 Global| Jan 19 2006
Housing Starts Fell To Lowest Level Since March
by:Tom Moeller
|in:Economy in Brief
Summary
Housing starts slumped 8.0% m/m last month to 1.933M units following a little revised 3.4% increase in November. The decline was to the lowest level since March but did not prevent starts for all of 2005 from rising 6.0% to a record [...]
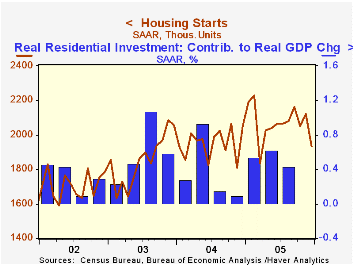
Housing starts slumped 8.0% m/m last month to 1.933M units following a little revised 3.4% increase in November. The decline was to the lowest level since March but did not prevent starts for all of 2005 from rising 6.0% to a record 2.066M. Consensus expectations had been for a lesser decline in December to 2.05M starts.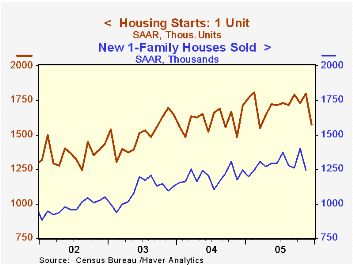
Single-family starts plummeted 12.3% m/m to 1.577M from the near record November level. The gain was most pronounced in the West where starts fell 21.7% (-17.1% y/y) and in the Midwest where single family starts dropped 22.6% (-23.8% y/y). In the Northeast single family starts fell for the fifth month in the last six, down 4.5% (-9.3% y/y) and in the South starts fell 4.2% (+4.3% y/y).
Multi family starts rose 10.2% m/m following a downwardly revised gain during November. Building permits fell 4.4% to the lowest level since May.
The latest Beige Book covering regional economic conditions in the US from the Federal Reserve Board can be found here.
| Housing Starts (000s, AR) | Dec | Nov | Y/Y | 2005 | 2004 | 2003 |
|---|---|---|---|---|---|---|
| Total | 1,933 | 2,121 | -5.7% | 2,066 | 1,950 | 1,854 |
| Single-family | 1,577 | 1,798 | -7.9% | 1,713 | 1,604 | 1,505 |
| Multi-family | 356 | 323 | 5.6% | 353 | 345 | 349 |
| Building Permits | 2,068 | 2,163 | -0.6% | 2,121 | 2,058 | 1,8 88 |
by Tom Moeller January 19, 2006
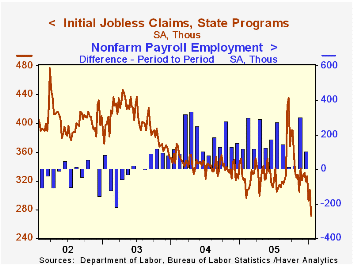
Initial claims for unemployment insurance dropped 36,000 to 271,000 last week following a downwardly revised 15,000 increase the prior week. Consensus expectations had been for 315,000 claims.
The latest figure covers the survey period for January nonfarm payrolls and initial claims fell a sharp 48,000 (15.0%) from the December period to the lowest level since March 2000.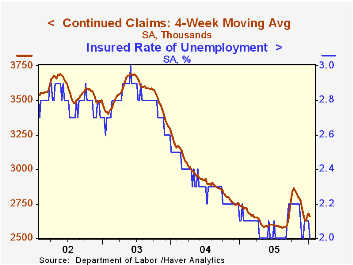
During the last ten years there has been a (negative) 75% correlation between the level of initial jobless insurance claims and the m/m change in payroll employment.
The four-week moving average of initial claims fell sharply to 299,000 (-11.2% y/y), its lowest level since July 2000.
Continuing unemployment insurance claims dropped a sharp 158,000 to the lowest level since February 2001.
The insured rate of unemployment fell to 2.0% after four weeks at 2.1%.
| Unemployment Insurance (000s) | 01/14/06 | 01/07/05 | Y/Y | 2005 | 2004 | 2003 |
|---|---|---|---|---|---|---|
| Initial Claims | 271 | 307 | -16.9% | 332 | 343 | 402 |
| Continuing Claims | -- | 2,534 | -6.4% | 2,663 | 2,924 | 3,532 |
by Tom Moeller January 19, 2006
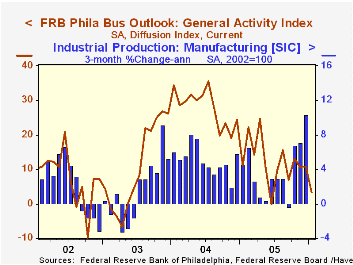
The Index of General Business Conditions in the manufacturing sector for January from the Philadelphia Fed fell sharply to 3.3 from 10.9 in December. Consensus expectations had been for improvement to 13.1. It was the lowest level for the index since last June.
During the last ten years there has been a 68% correlation between the level of the Philadelphia Fed Business Conditions Index and three month growth in factory sector industrial production. There has been a 50% correlation with q/q growth in real GDP.
The business conditions index reflects a separate survey question, not the sub indexes, and most of the sub indexes improved this month versus December.
The sub index measuring new orders rose to 11.1, its highest since October, from 5.8. Shipments also rose to 18.6 from 9.4 while the index covering the number of employees advanced to 11.7 from 7.9. During the last ten years there has been a 64% correlation between the employment index and the three month growth in factory payrolls.
The separate index of expected business conditions in six months fell moderately, reversing most of the revised rise in December. Expectations for employment also backpedaled after sharp improvement during December.
The prices paid index fell moderately and the index of future prices fell to its lowest level since last June. During the last ten years there has been a 75% correlation between the prices paid index and the three month growth in the intermediate goods PPI. The correlation with the finished goods PPI has been 50% and with the CPI it's been 43%.
The latest Business Outlook survey from the Philadelphia Federal Reserve Bank can be found here.
| Philadelphia Fed Business Outlook | Jan | Dec | Jan '05 | 2005 | 2004 | 2003 |
|---|---|---|---|---|---|---|
| General Activity Index | 3.3 | 10.9 | 11.0 | 12.4 | 28.0 | 10.5 |
| Prices Paid Index | 44.9 | 47.1 | 64.1 | 43.5 | 51.2 | 16.8 |
by Carol Stone January 19, 2006
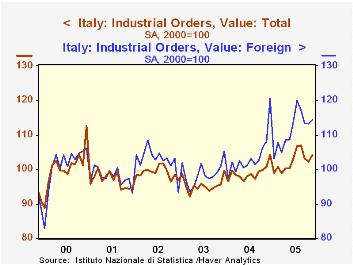
Industrial sales and orders rebounded markedly in Italy in November after pausing in October, according to data reported today by Istat, the Italian national statistical agency. Total orders gained 1.8% and stand 4.0% above a year ago, while sales (often called “turnover” there) were up 1.6% in the month and 4.4% on the year.
As the case in much of Europe, the foreign sector is tending to run ahead of the domestic economy. For the entire period since the index base year of 2000, foreign orders are up 14.5%, while domestic orders have been virtually flat. In the past year, foreign orders are up 5.8% and foreign sales by 7.6%, compared with somewhat over 3% for domestic orders and sales.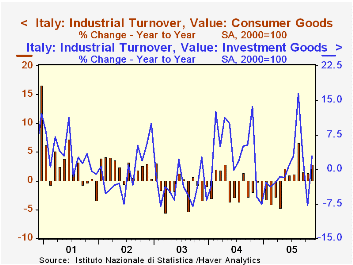
Individual industries are experiencing mixed fortunes, with electrical equipment, furniture and chemicals advancing in the last year. Metals and machinery see slowing growth, and transportation equipment and wood products have been flat. Finally, textiles and paper products are declining.
By type, consumer goods turnover seems recently to have the most consistent growth, albeit less dramatic expansion. Capital goods are tending to expand, but very unevenly from month-to-month, so there is little identifiable momentum. Energy products are very strong, but other intermediate goods have been erratic and trendless.
A reminder that these data appear in several Haver databases: most obviously in ITALY, our comprehensive and detailed country-source database. But also, a summary is presented in G10, a collection of major industrial countries in Europe plus the US, Canada, and Japan. And EUROSTAT, compiled from Eurostat, the EU statistical agency, contains an array of industrial orders throughout Europe.
| Italy Industry | Nov 2005Oct 2005 | Year Ago | 2004 | 2003 | 2002 | ||
|---|---|---|---|---|---|---|---|
| Index* | % Chg | ||||||
Sales |
109.6 | 1.6 | -0.6 | 4.4 | 3.1 | -1.0 | 1.1 |
| Domestic | 108.2 | 1.4 | -0.3 | 3.3 | 2.9 | -0.6 | 0.8 |
| Foreign | 113.5 | 2.0 | -1.4 | 7.6 | 3.6 | -2.3 | 1.7 |
| Orders | 104.1 | 1.8 | -0.9 | 4.0 | 4.7 | -3.8 | 2.3 |
| Domestic | 99.5 | 2.1 | -1.3 | 3.1 | 3.9 | -3.5 | 1.0 |
| Foreign | 114.5 | 1.1 | -0.1 | 5.8 | 6.3 | -4.2 | 5.1 |

Tom Moeller
AuthorMore in Author Profile »Prior to joining Haver Analytics in 2000, Mr. Moeller worked as the Economist at Chancellor Capital Management from 1985 to 1999. There, he developed comprehensive economic forecasts and interpreted economic data for equity and fixed income portfolio managers. Also at Chancellor, Mr. Moeller worked as an equity analyst and was responsible for researching and rating companies in the economically sensitive automobile and housing industries for investment in Chancellor’s equity portfolio. Prior to joining Chancellor, Mr. Moeller was an Economist at Citibank from 1979 to 1984. He also analyzed pricing behavior in the metals industry for the Council on Wage and Price Stability in Washington, D.C. In 1999, Mr. Moeller received the award for most accurate forecast from the Forecasters' Club of New York. From 1990 to 1992 he was President of the New York Association for Business Economists. Mr. Moeller earned an M.B.A. in Finance from Fordham University, where he graduated in 1987. He holds a Bachelor of Arts in Economics from George Washington University.
More Economy in Brief


