 Global| Feb 18 2004
Housing Starts Down With Temps
by:Tom Moeller
|in:Economy in Brief
Summary
Housing starts dropped 7.9% last month as nationwide temperatures plummeted to the coldest since 2000. It was the first m/m decline since August. December starts were revised slightly lower due to a lowered figure for multi-family [...]
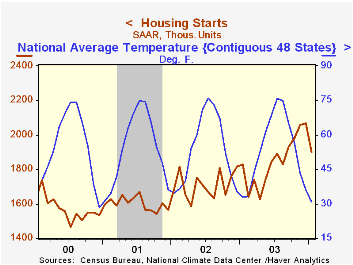
Housing starts dropped 7.9% last month as nationwide temperatures plummeted to the coldest since 2000. It was the first m/m decline since August.
December starts were revised slightly lower due to a lowered figure for multi-family starts. Consensus forecasts had been for 2.00 million starts in January.
Single family starts fell 8.0%. The shallow decline in December from the record level in November was lessened.
Multi-family starts fell 7.8% following a downwardly revised 4.2% gain in December.
Housing starts fell hard m/m in the Northeast (2.1% y/y) for the third month in four. In the Midwest starts also fell sharply for the third month in four (-8.6% y/y). Starts fell 5.2% m/m in the South (12.0% y/y) and in the West starts were off just 1.0% (+0.8% y/y).
Building permits fell 2.8% m/m (+6.9% y/y).
| Housing Starts (000s, AR) | Jan | Dec | Y/Y | 2003 | 2002 | 2001 |
|---|---|---|---|---|---|---|
| Total | 1,903 | 2,067 | 4.1% | 1,848 | 1,711 | 1,601 |
| Single-family | 1,537 | 1,670 | 1.9% | 1,501 | 1,364 | 1,272 |
| Multi-family | 366 | 397 | 14.7% | 347 | 347 | 330 |
| Building Permits | 1,899 | 1,953 | 6.9% | 1,831 | 1,750 | 1,637 |
by Tom Moeller February 18, 2004
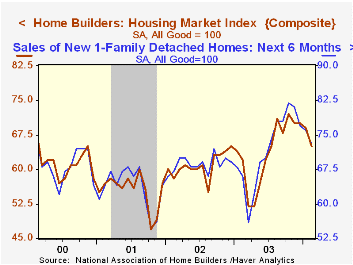
The Composite Housing Market Index reported by the National Association of Home Builders (NAHB) fell 5.8% in February to 65 (+4.8% y/y). It was the third decline in four months.
During the last fifteen years there has been a 79% correlation between the y/y change in the NAHB index and the change in single family housing starts.
The sub index which measures expected home sales in six months fell to the lowest level since June.
The index of current market conditions for home sales fell 5.3% m/m to 72 (+4.3% y/y), the lowest level since July.
Traffic of prospective buyers fell hard and is off 16.4% from the August peak.
The NAHB index is a diffusion index based on a survey of builders. Readings above 50 signal that more builders view conditions as good than poor.
Visit the National Association of Home Builders using this link.
| Nat'l Association of Home Builders | Feb | Jan | Y/Y | 2003 | 2002 | 2001 |
|---|---|---|---|---|---|---|
| Composite Housing Market Index | 65 | 69 | 62 | 64 | 61 | 56 |
by Tom Moeller February 18, 2004
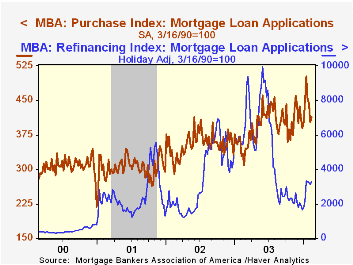
The index of mortgage applications compiled by the Mortgage Bankers Association rose 4.9% last week following a 6.8% decline the week prior. The index is up slightly in February from the January average.
Applications to refinance rose 6.4% w/w and are up 15.7% this month versus January.
The effective interest rate on a conventional 30-Year mortgage fell to 5.74% from 5.88% the prior week. The low for 30-year financing was last June at 5.41%. The effective rate on a 15-year mortgage fell to 5.11%. The low was 4.87% last June.
Purchase applications rose 2.0% w/w (+23.9% y/y) but the February average is off 9.1% from January.
During the last ten years there has been a 55% correlation between the y/y change in purchase applications and the change in new plus existing home sales.
The Mortgage Bankers Association surveys between 20 to 35 of the top lenders in the U.S. housing industry to derive its refinance, purchase and market indexes. The weekly survey accounts for more than 40% of all applications processed each week by mortgage lenders. Visit the Mortgage Bankers Association site here.
| MBA Mortgage Applications (3/16/90=100) | 2/13/04 | 1/06/04 | 2003 | 2002 | 2001 |
|---|---|---|---|---|---|
| Total Market Index | 837.1 | 797.8 | 1,067.9 | 799.7 | 625.6 |
| Purchase | 413.9 | 402.2 | 395.1 | 354.7 | 304.9 |
| Refinancing | 3,298.3 | 3,099.1 | 4,981.8 | 3,388.0 | 2,491.0 |
by Tom Moeller February 18, 2004
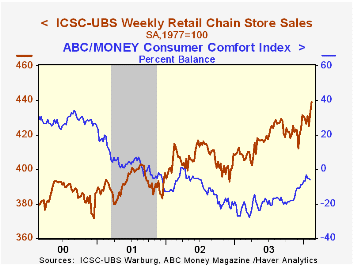
Chain store sales surged another 1.4% last week following the prior week's 1.8% spurt, according to the ICSC-UBS survey.
Sales in February are up 1.7% versus the average January level.
During the last ten years there has been a 59% correlation between the year-to-year percent change in the ICSC-UBS measure of chain store sales and the change in non-auto retail sales less gasoline.
The ICSC-UBS retail chain-store sales index is constructed using the same-store sales reported by 78 stores of seven retailers: Dayton Hudson, Federated, Kmart, May, J.C. Penney, Sears and Wal-Mart.
| ICSC-UBS (SA, 1977=100) | 02/14/04 | 02/07/04 | Y/Y | 2003 | 2002 | 2001 |
|---|---|---|---|---|---|---|
| Total Weekly Retail Chain Store Sales | 438.9 | 432.9 | 7.5% | 2.9% | 3.6% | 2.1% |

Tom Moeller
AuthorMore in Author Profile »Prior to joining Haver Analytics in 2000, Mr. Moeller worked as the Economist at Chancellor Capital Management from 1985 to 1999. There, he developed comprehensive economic forecasts and interpreted economic data for equity and fixed income portfolio managers. Also at Chancellor, Mr. Moeller worked as an equity analyst and was responsible for researching and rating companies in the economically sensitive automobile and housing industries for investment in Chancellor’s equity portfolio. Prior to joining Chancellor, Mr. Moeller was an Economist at Citibank from 1979 to 1984. He also analyzed pricing behavior in the metals industry for the Council on Wage and Price Stability in Washington, D.C. In 1999, Mr. Moeller received the award for most accurate forecast from the Forecasters' Club of New York. From 1990 to 1992 he was President of the New York Association for Business Economists. Mr. Moeller earned an M.B.A. in Finance from Fordham University, where he graduated in 1987. He holds a Bachelor of Arts in Economics from George Washington University.
More Economy in Brief


