 Global| Jun 17 2004
Hong Kong Employment Rises, But Underemployment Still High
Summary
The labor market in Hong Kong looks to be improving gradually. Employment is rising month by month and has done so six of the last seven months. This is a distinct turnaround from declines that spanned most of the previous nine [...]
The labor market in Hong Kong looks to be improving gradually. Employment is rising month by month and has done so six of the last seven months. This is a distinct turnaround from declines that spanned most of the previous nine months. Hong Kong reports its labor market data as trailing three-month averages, so the turn to a new trend is more impressive.
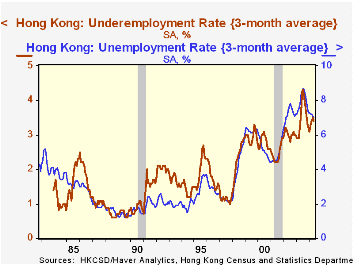
This employment growth has been accompanied by a slowly falling trend in unemployment. At 7.0% in May, the unemployment rate is still historically high, but is well off a peak of 8.7% in July 2003. An accompanying measure of underutilization, so-called "underemployment" is more stubborn. It too is down from a peak last June and July, but has drifted back upward this spring. "Underemployment" represents employed workers who work involuntarily fewer than 35 hours per week. The comparable US concept is "part-time for economic reasons". Thus, even though employment is growing, a sizable share of workers -- near an all-time large share -- are forced to work an abbreviated workweek.
In the accompanying graph, we see that the recent peak in these "underutilization rates" (our term) was likely related to the protracted recession in Japan. Now that that economy has started to expand more definitively, both unemployment and underemployment in Hong Kong may well dissipate more consistently.
| Select Labor Market Indicators (%, except where noted) | May 2004 | Apr 2004 | Mar 2004 | May 2003 | 2003 | 2002 | 2001 |
|---|---|---|---|---|---|---|---|
| Employment, Mo/MoChange (Thous) | 2.7 | 5.3 | 11.7 | 40.2 | -20.0 | 14.6 | -11.2 |
| Yr/Yr % change | 1.2 | 0.7 | 0.4 | -- | -0.6 | 0.5 | -0.4 |
| Underemployment % of Employment | 3.6 | 3.8 | 3.7 | 4.0 | 3.8 | 3.3 | 2.6 |
| Underemployment Rate % of Labor Force | 3.4 | 3.5 | 3.4 | 3.6 | 3.5 | 3.0 | 2.5 |
| Unemployment Rate | 7.0 | 7.1 | 7.2 | 8.3 | 7.9 | 7.3 | 5.1 |
| Underutilized Labor Force (Sum of Unemployment and Underemployment) |
10.4 | 10.6 | 10.6 | 11.9 | 11.4 | 10.3 | 7.6 |
Carol Stone, CBE
AuthorMore in Author Profile »Carol Stone, CBE came to Haver Analytics in 2003 following more than 35 years as a financial market economist at major Wall Street financial institutions, most especially Merrill Lynch and Nomura Securities. She had broad experience in analysis and forecasting of flow-of-funds accounts, the federal budget and Federal Reserve operations. At Nomura Securities, among other duties, she developed various indicator forecasting tools and edited a daily global publication produced in London and New York for readers in Tokyo. At Haver Analytics, Carol was a member of the Research Department, aiding database managers with research and documentation efforts, as well as posting commentary on select economic reports. In addition, she conducted Ways-of-the-World, a blog on economic issues for an Episcopal-Church-affiliated website, The Geranium Farm. During her career, Carol served as an officer of the Money Marketeers and the Downtown Economists Club. She had a PhD from NYU's Stern School of Business. She lived in Brooklyn, New York, and had a weekend home on Long Island.
More Economy in Brief


