 Global| Jun 01 2006
Home Prices Rose More Slowly
by:Tom Moeller
|in:Economy in Brief
Summary
Home prices as measured by the Office of Federal Housing Enterprise Oversight (OFHEO) rose another 2.0% last quarter. The increase was the slowest after rising between 2.5% and 4.5% each quarter for two years. The OFHEO house price [...]
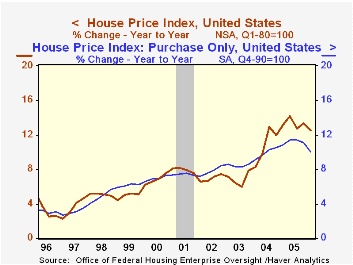
Home prices as measured by the Office of Federal Housing Enterprise Oversight (OFHEO) rose another 2.0% last quarter. The increase was the slowest after rising between 2.5% and 4.5% each quarter for two years.
The OFHEO house price index is a geometric weighted average based on more than 26.5 million repeat transactions (purchase or refinance) over 29 years and 12,000 transactions annually.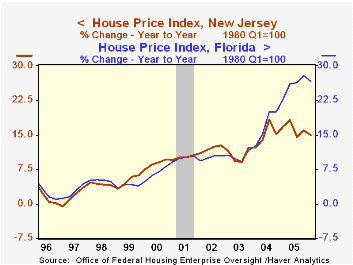
Year to year, the 12.5% gain in prices nationwide was the slowest since late 2004.
The purchase only home price index rose 1.8% (10.1% y/y), also its slowest gain in nearly three years after quarterly gains which ranged between 2.1% and 2.9%.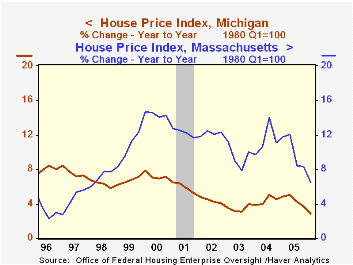
Slower growth in home prices ranged across the country but was pronounced in Massachusetts where prices rose just 0.5% (6.5% y/y). That y/y gain is down from a peak of 14.4% in 2000 and 10.1% last year. Prices also inched up just 0.2% (2.9% y/y) in Michigan, the slowest y/y gain since 1993. In South Dakota, home prices fell 0.1% (+6.1% y/y).
In New York, house prices rose 1.9% (12.4% y/y) and in California prices rose 2.5% (19.2% y/y), a slowdown from the 28.0% y/y gain in late 2004.
House price appreciation continued strong in Florida as evidenced by a 4.3% (26.6% y/y) gain. Last year prices in Florida rose 25.9% and in 2004 were up 17.0%.
View the latest OFHEO release here.
| OFHEO | 1Q06 | 4Q05 | Y/Y | 2005 | 2004 | 2003 |
|---|---|---|---|---|---|---|
| House Price Index | 2.0% | 3.1% | 12.5% | 13.3% | 10.8% | 6.9% |
by Tom Moeller June 1, 2006
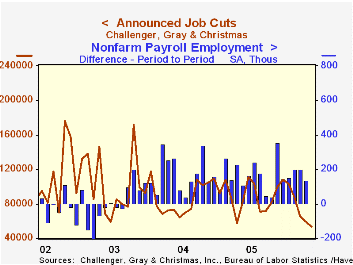
The Challenger, Grey & Christmas survey indicated that announced job cuts fell another 10.0% last month and have now fallen in each month of 2006. The decline was to the lowest level since late 2000.
During the last ten years there has been an 83% (inverse) correlation between the three month moving average level of announced job cuts and the three month change payroll employment.
Layoffs fell in transportation (-58.3% y/y) and energy (-97.0% y/y) as did job cuts in electronics (-89.0 y/y), industrial goods (-13.4% y/y), insurance (-61.2% y/y), media (+15.9% y/y) and real estate (-75.0% y/y).
Job cut announcements differ from layoffs. Many are achieved through attrition, early retirement or just never occur.
Challenger also reported a sharp m/m drop in announced hiring plans (-34.1% y/y).
| Challenger, Gray & Christmas | May | April | Y/Y | 2005 | 2004 | 2003 |
|---|---|---|---|---|---|---|
| Announced Job Cuts | 53,716 | 59,688 | -34.7% | 1,072,054 | 1,039,935 | 1,236,426 |
by Tom Moeller June 1, 2006
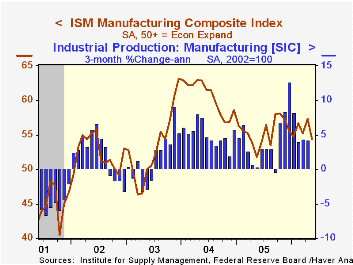
The Institute of Supply Management (ISM) reported that the May Composite Index of factory sector activity reversed more than all of the prior month's gain and fell to 54.4. Consensus expectations had been for a more moderate decline to 56.0.
During the last twenty years there has been a 68% correlation between the level of the Composite Index and the three month growth in factory sector industrial production.
New orders fell for the fourth month of 2006 to the lowest level (53.7) in a year. New export orders, however, recovered about half of an April decline and rose to 55.7. During the last nineteen years there has been a 68% correlation between the level of the ISM export index and the y/y change in real exports of goods.
A 3.2 point decline in the production index to 57.2 also reversed all of the prior month's sharp gain while employment (52.9) fell for the third month this year. During the last twenty years there has been a 67% correlation between the level of the ISM employment Index and the three month growth in factory sector employment.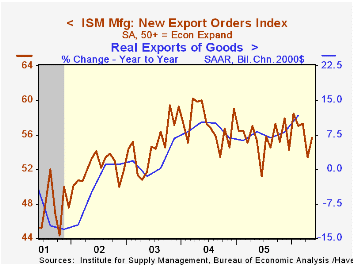
The inventory index fell as well to 48.0 and the supplier deliveries index eased to 57.6 from 57.7.
The price index rose 5.5 points to the highest level since October. During the last twenty years there has been a 91% correlation between the price index and the three month change in the PPI for intermediate goods less food & energy.
Are We Engineering Ourselves Out of Manufacturing Jobs? from the Federal Reserve Bank of Cleveland can be found here.
| ISM Manufacturing Survey | May | April | May '05 | 2005 | 2004 | 2003 |
|---|---|---|---|---|---|---|
| Composite Index | 54.4 | 57.3 | 51.8 | 55.5 | 60.5 | 53.3 |
| New Orders Index | 53.7 | 57.6 | 51.9 | 57.4 | 63.5 | 57.9 |
| Prices Paid Index (NSA) | 77.0 | 71.5 | 58.0 | 66.4 | 79.8 | 59.6 |
by Tom Moeller June 1, 2006
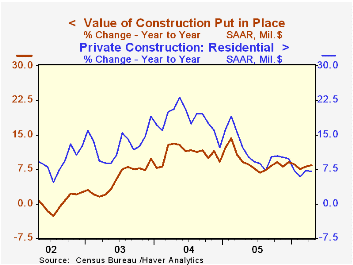
The value of construction put in place slipped 0.1% in April after a downwardly revised 0.9% March increase. Consensus expectations had been for no change.
Residential building reversed all of a downwardly revised 1.0% March gain. New single family building slumped 1.6% (11.5% y/y), the first monthly decline in over a year, and the value of spending on improvements fell 0.5% (-6.9% y/y).
Nonresidential building improved 2.5% following an upwardly revised 0.6% March increase as office construction surged 3.0% (13.8% y/y) and commercial building rose 1.8% (6.5% y/y). Multi-retail building jumped 2.0% (33.2% y/y) led by a 6.0% (52.7% y/y) ramp-up in the value of building shopping malls.
Public construction spending slipped 0.2% though construction activity on highways & streets, nearly one third of the value of public construction spending, rose 0.4% (10.7% y/y).
These more detailed categories represent the Census Bureau’s reclassification of construction activity into end-use groups. Finer detail is available for many of the categories; for instance, commercial construction is shown for Automotive sales and parking facilities, drugstores, building supply stores, and both commercial warehouses and mini-storage facilities. Note that start dates vary for some seasonally adjusted line items in 2000 and 2002 and that constant-dollar data are no longer computed.
| Construction Put-in-place | April | March | Y/Y | 2005 | 2004 | 2003 |
|---|---|---|---|---|---|---|
| Total | -0.1% | 0.9% | 8.5% | 9.2% | 10.9% | 5.4% |
| Private | -0.1% | 0.9% | 8.6% | 9.7% | 13.6% | 6.3% |
| Residential | -1.1% | 1.0% | 7.1% | 11.5% | 18.2% | 12.9% |
| Nonresidential | 2.5% | 0.6% | 12.2% | 5.4% | 3.9% | -5.4% |
| Public | -0.2% | 0.8% | 8.2% | 7.6% | 2.5% | 2.7% |
by Tom Moeller June 1, 2006
Non-farm labor productivity growth during 1Q '06 was revised up to 3.7% from the 3.2% reported last month. The updated figure fell short of Consensus expectations for a revision to 4.0%.
Faster growth in output accounted for the revision and it is now estimated to have risen 6.5% (4.2% y/y) versus the earlier estimate of 5.8% growth. The estimate of hours worked was little changed at 2.7% (1.7% y/y).
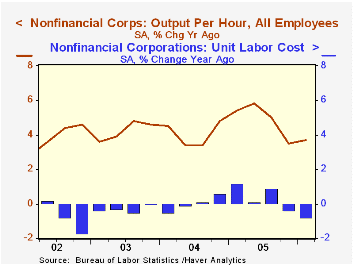
Unit labor cost growth was revised down sharply to 1.6% reflecting the upward revision to productivity as well as a downward revision to compensation growth to 5.3%. Cost pressure in 4Q '05 also was revised down sharply due to a revised decline in compensation.
Factory sector productivity growth was slightly slower than initially estimated at 3.8% (4.0% y/y) versus the initial estimate of 4.2%. As a result of an upward revision to compensation growth to 1.9% (2.1% y/y) from 1.5%, unit labor costs in the factory sector only declined 1.9% (-1.8% y/y) instead of the initial estimate of a 2.6% drop.
A Leaner, More Skilled U.S. Manufacturing Workforce from the Federal Reserve Bank of New York is available here.
This first estimate of nonfinancial corporate sector productivity indicated a 3.7% (3.7% y/y) gain after 2.4% growth during 4Q. Unit labor costs rose 1.3% q/q but since the moderate rise followed a 3.2% 4Q decline, costs remained down 0.8% from the year earlier level.
| Non-farm Business Sector (SAAR) | 1Q' 06 (Revised | 1Q '06 | 4Q '05 | Y/Y | 2005 | 2004 | 2003 |
|---|---|---|---|---|---|---|---|
| Output per Hour | 3.7% | 3.2% | -0.3% | 2.5% | 2.7% | 3.4% | 3.9% |
| Compensation per Hour | 5.3% | 5.7% | -0.9% | 2.8% | 5.1% | 4.6% | 4.0% |
| Unit Labor Costs | 1.6% | 2.5% | -0.6% | 0.3% | 2.3% | 1.1% | 0.0% |
by Tom Moeller June 1, 2006
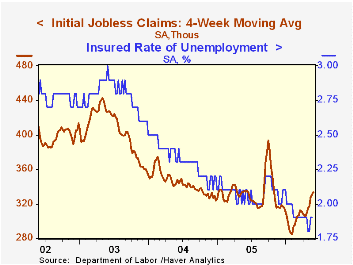
Initial unemployment insurance claims rose 7,000 last week to 336,000 from an unrevised level the prior week. Consensus expectations had been for 320,000 claims.
The four week moving average of initial claims rose to 333,500 (-0.5% y/y) as a result of earlier increases in Puerto Rico.
Continuing claims for unemployment insurance rose 19,000 following a downwardly revised 32,000 rise during the prior week.
The insured rate of unemployment was stable at 1.9%.
The minutes to the latest meeting of the Federal Open Market Committee are available here.
| Unemployment Insurance (000s) | 05/27/06 | 05/20/06 | Y/Y | 2005 | 2004 | 2003 |
|---|---|---|---|---|---|---|
| Initial Claims | 336 | 329 | -2.9% | 332 | 343 | 403 |
| Continuing Claims | -- | 2,433 | -6.7% | 2,663 | 2,923 | 3,530 |
by Carol Stone June 1, 2006
The PMI is a simple survey, asking procurement officers of companies how major measures of their business have behaved in the latest month. Did production go up or down? Did orders go up or down? Did they add employees or reduce their number? and so on. The results are stated as the number of firms reporting an increase plus half the number reporting no change; anything above 50% indicates an economic expansion. These surveys, coordinated mainly by NTC Economics in London, are becoming available in more and more countries; the table below includes a cross-section from several regions of the world.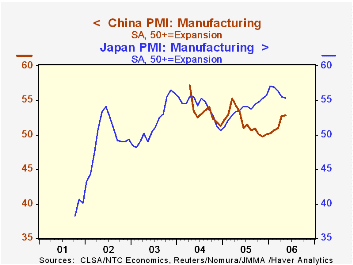
May's results for manufacturers, reported on June 1 for nearly all participating countries, generally show a moderately widespread expansion. The margin narrowed in the US, as Tom Moeller highlights here in a separate article, but the indexes were steady or higher in the Euro-Zone, China and South Africa. Among the countries we perused, only Australia showed any notable weakness, falling to 48.93 from 50.27 in April, but this is less severe than it was last autumn. Japan looks to be moving through a slower growth period after peaking in January, but so far the moderation is less than 2 index points.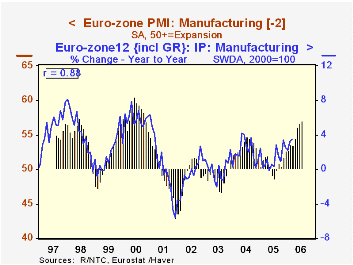
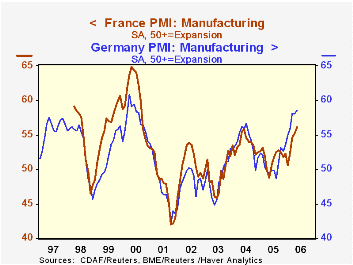
The European performance is striking. The overall index and the output component both reached their highest levels since August 2000. New orders were off slightly in May, but are hovering in a high range. Even employment has been ratcheting upward since the spring of 2003; this last is a relative movement. Only since December has the employment index been at or above 50%, so until that time "improvement" meant that progressively fewer companies were reporting contractions in the number of workers. Even so, we've so often thought of Europe in the doldrums and these data suggest that's not the case.
In fact, we're fairly impressed with these manufacturing industry performances. Unfortunately, the data for the non-US countries don't have much history, so we can't see how they relate to entire business cycles. However, the Euro-Zone combined index, which began in June 1997, has a remarkable 88% correlation with the year-to-year growth in manufacturing production in the Euro-Zone, with a lead of two months. This suggests more strength to come in Euro-Zone production data. In the face of rising prices of energy, commodities and other inputs, this suggests perhaps more resilience than we'd have envisioned for the European producers.
| PMI Diffusion Indexes | May 2006 | April 2006 |
|---|---|---|
| Euro-Zone | 57.02 | 56.73 |
| Germany | 58.53 | 58.11 |
| France | 56.14 | 55.31 |
| Japan | 55.31 | 55.52 |
| China | 52.83 | 52.72 |
| Australia | 48.93 | 50.27 |
| South Africa | 57.6 | 54.3 |
| Memo: US | 54.4 | 57.3 |

Tom Moeller
AuthorMore in Author Profile »Prior to joining Haver Analytics in 2000, Mr. Moeller worked as the Economist at Chancellor Capital Management from 1985 to 1999. There, he developed comprehensive economic forecasts and interpreted economic data for equity and fixed income portfolio managers. Also at Chancellor, Mr. Moeller worked as an equity analyst and was responsible for researching and rating companies in the economically sensitive automobile and housing industries for investment in Chancellor’s equity portfolio. Prior to joining Chancellor, Mr. Moeller was an Economist at Citibank from 1979 to 1984. He also analyzed pricing behavior in the metals industry for the Council on Wage and Price Stability in Washington, D.C. In 1999, Mr. Moeller received the award for most accurate forecast from the Forecasters' Club of New York. From 1990 to 1992 he was President of the New York Association for Business Economists. Mr. Moeller earned an M.B.A. in Finance from Fordham University, where he graduated in 1987. He holds a Bachelor of Arts in Economics from George Washington University.
More Economy in Brief


