 Global| Feb 27 2008
Home Price Appreciation Weakest Since 1990
by:Tom Moeller
|in:Economy in Brief
Summary
According to the Office of Federal Housing Enterprise Oversight (OFHEO) home prices in the U.S. rose just 0.1% last quarter. That rounded out a year end gain of just 0.8%, and of 2.8% for the full year. These rates of increase were [...]
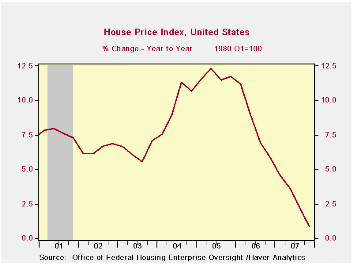
According to the Office of Federal Housing Enterprise Oversight (OFHEO) home prices in the U.S. rose just 0.1% last quarter. That rounded out a year end gain of just 0.8%, and of 2.8% for the full year. These rates of increase were the slowest since the 1990s, although the slowing did follow gains earlier this decade which were the strongest since the late 1970s.
The House Price Indices in this report are weighted indexes based on repeat sales or refinancings using data provided by Fannie Mae or Freddie Mac. The overall figures are available in Haver's USECON data base and the state figures are in US REGIONAL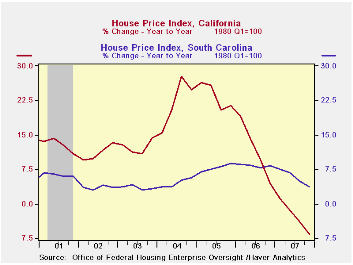
Home price performance varied greatly last year across the country to net out at the slight 0.8% overall uptick. Down hard were home prices in California though rates of appreciation slowed most every where. A 6.6% decline in prices 4Q/4Q was followed just barely by a 4.7% rate of decline in Florida. These declines pulled prices down for the full year but both annual shortfalls followed double digit gains in 2006. That was not, however, the pattern in Michigan where prices have declined steadily since 2005.
If prices in other regions did rise 4Q/4Q the rates of increase were down most everywhere. New York squeezed out a 0.7% price increase last year but it followed much more respectable gains in 2006 and 2005. The same pattern was true for neighboring New Jersey and Pennsylvania.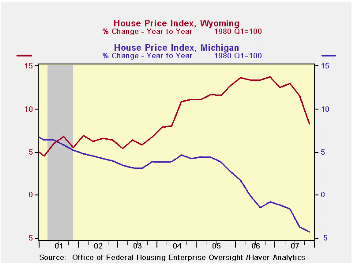
In the South and certainly in the West, other than in California, home price appreciation barely took a breadth. For the full year 2007, double digit gains in Wyoming were accompanied by respectable price increases in Texas and South Carolina. Neighboring North Carolina and Tennessee did well as well.
The latest report from the Office of Federal Housing Enterprise Oversight (OFHEO) can be found here.
| House Price Index (OFHEO, %) | 4Q '07 | 3Q '07 | Y/Y | 2007 | 2006 | 2005 |
|---|---|---|---|---|---|---|
| United States | 0.1 | -0.2 | 0.8 | 2.8 | 8.2 | 11.8 |
| California | -3.1 | -1.9 | -6.6 | -2.7 | 11.5 | 23.3 |
| Florida | -1.7 | -2.1 | -4.7 | -0.3 | 17.2 | 25.6 |
| Michigan | 0.1 | -2.5 | -4.3 | -2.7 | -0.2 | 3.9 |
| Massachusetts | 0.8 | -1.4 | -2.2 | -1.6 | 1.9 | 9.7 |
| Wyoming | 0.3 | 2.7 | 8.3 | 11.2 | 13.5 | 11.8 |
| Texas | 0.7 | 1.0 | 5.2 | 6.4 | 6.3 | 4.6 |
| South Carolina | 1.6 | 0.1 | 3.8 | 5.7 | 8.3 | 7.8 |
| New York | 0.6 | -0.6 | 0.7 | 2.2 | 8.2 | 13.4 |

Tom Moeller
AuthorMore in Author Profile »Prior to joining Haver Analytics in 2000, Mr. Moeller worked as the Economist at Chancellor Capital Management from 1985 to 1999. There, he developed comprehensive economic forecasts and interpreted economic data for equity and fixed income portfolio managers. Also at Chancellor, Mr. Moeller worked as an equity analyst and was responsible for researching and rating companies in the economically sensitive automobile and housing industries for investment in Chancellor’s equity portfolio. Prior to joining Chancellor, Mr. Moeller was an Economist at Citibank from 1979 to 1984. He also analyzed pricing behavior in the metals industry for the Council on Wage and Price Stability in Washington, D.C. In 1999, Mr. Moeller received the award for most accurate forecast from the Forecasters' Club of New York. From 1990 to 1992 he was President of the New York Association for Business Economists. Mr. Moeller earned an M.B.A. in Finance from Fordham University, where he graduated in 1987. He holds a Bachelor of Arts in Economics from George Washington University.
More Economy in Brief


