 Global| Dec 02 2005
Home Price Appreciation Strong, But Off Record Pace
by:Tom Moeller
|in:Economy in Brief
Summary
According to the Office of Federal Housing Enterprise Oversight (OFHEO) home prices in the U.S. continued to rise last quarter, but the rate of escalation showed signs of topping out. The 2.9% q/q rise was down from the prior quarter [...]
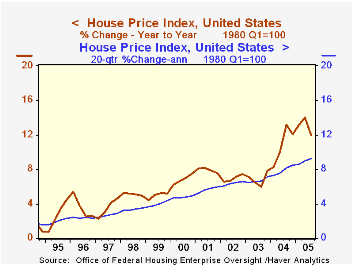
According to the Office of Federal Housing Enterprise Oversight (OFHEO) home prices in the U.S. continued to rise last quarter, but the rate of escalation showed signs of topping out. The 2.9% q/q rise was down from the prior quarter and was down from a 4.7% jump one year ago. As a result the y/y gain slowed to 12.0% from 14.0% in 2Q.
These rates of gain are hardly slow, and given the near record level of home sales, historically low interest rates and rising personal incomes they are widely expected to remain healthy.
Throughout the country, rates of home price appreciation appear to have topped. However, the variance in the rates of growth between regions is high.
During the last year, job cutbacks in the auto industry helped lower the rate of home price appreciation in Michigan to 4.0% and the state's gain has lagged all others. At the other end of the spectrum, demographic trends pushed the rate of home price appreciation in Arizona to the top of the scale at 30.3% y/y.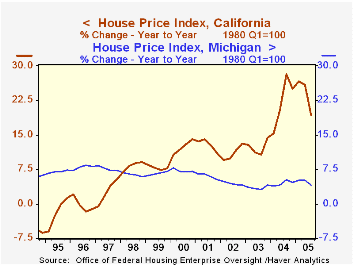
During the last five years, home price appreciation in the District of Columbia has surpassed all others at 118.9% followed closely by California at 112.8%. Indiana with a 20.6% rise is at the bottom of the list during the last five years.
The House Price Indices in this report are weighted indexes based on repeat sales or refinancings using data provided by Fannie Mae or Freddie Mac .
Housing Markets and Demographics from the Federal Reserve Bank of San Francisco can be found here.
The latest report from the Office of Federal Housing Enterprise Oversight (OFHEO) can be found here.
| House Price Index (OFHEO) | 3Q '05 | 2Q '05 | Y/Y | 2004 | 2003 | 2002 |
|---|---|---|---|---|---|---|
| United States | 2.9% | 3.6% | 12.0% | 10.9% | 6.9% | 6.9% |
| California | 4.2% | 5.6% | 19.3% | 22.4% | 12.3% | 11.1% |
| New Jersey | 3.1% | 4.4% | 13.7% | 15.0% | 10.5% | 12.0% |
| Alabama | 2.2% | 2.5% | 8.1% | 4.1% | 4.1% | 3.0% |
| Michigan | 0.9% | 1.0% | 4.0% | 4.4% | 3.5% | 4.4% |

Tom Moeller
AuthorMore in Author Profile »Prior to joining Haver Analytics in 2000, Mr. Moeller worked as the Economist at Chancellor Capital Management from 1985 to 1999. There, he developed comprehensive economic forecasts and interpreted economic data for equity and fixed income portfolio managers. Also at Chancellor, Mr. Moeller worked as an equity analyst and was responsible for researching and rating companies in the economically sensitive automobile and housing industries for investment in Chancellor’s equity portfolio. Prior to joining Chancellor, Mr. Moeller was an Economist at Citibank from 1979 to 1984. He also analyzed pricing behavior in the metals industry for the Council on Wage and Price Stability in Washington, D.C. In 1999, Mr. Moeller received the award for most accurate forecast from the Forecasters' Club of New York. From 1990 to 1992 he was President of the New York Association for Business Economists. Mr. Moeller earned an M.B.A. in Finance from Fordham University, where he graduated in 1987. He holds a Bachelor of Arts in Economics from George Washington University.
More Economy in Brief


