 Global| Mar 05 2002
Higher Commodity Prices Add Further to Recovery Signal
by:Tom Moeller
|in:Economy in Brief
Summary
Prices for industrial commodities have risen roughly 7% since the lows last November according to the FIBER index of industrial materials price index (formerly the Journal of Commerce index). The FIBER index is heavily weighted toward [...]
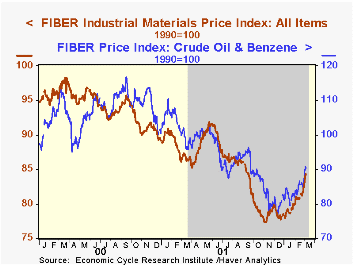
Prices for industrial commodities have risen roughly 7% since the lows last November according to the FIBER index of industrial materials price index (formerly the Journal of Commerce index).
The FIBER index is heavily weighted toward crude oil and benzene prices which are up 13% during the period.
Prices in other categories also have risen since the fall including metals (+6%), textiles (+3%) and miscellaneous commodities (+11%).
During the last twenty years there has been a 46% correlation between the three-month percent change in the FIBER index and the three-month change in factory sector industrial production.
| FIBER Industrial Materials Price Index (1990=100) | 03/01/02 | 02/01/02 | Y/Y | 2001 | 2000 | 1999 |
|---|---|---|---|---|---|---|
| All Items | 83.21 | 80.18 | -4.0% | 85.28 | 94.18 | 92.50 |
by Tom Moeller March 5, 2002
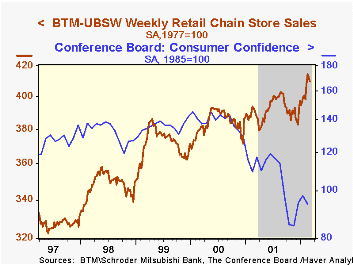
Chain store sales fell 0.8% last week. It was the second consecutive week that sales declined following two consecutive weeks during which sales rose 4%.
With the full month results now in sales for February are 2.5% above January.
During the last ten years there has been a 20% correlation between the monthly percent change in chain store sales and the change in consumer confidence.
| BTM-UBSW (SA, 1977=100) | 3/02/02 | 02/23/02 | Y/Y | 2001 | 2000 | 1999 |
|---|---|---|---|---|---|---|
| Total Weekly Retail Chain Store Sales | 409.8 | 413.1 | 4.7% | 2.1% | 3.4% | 6.7% |
by Tom Moeller March 5, 2002
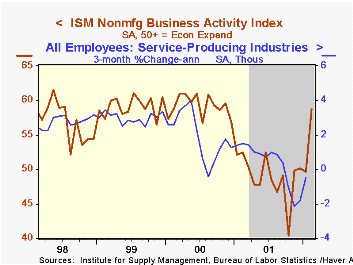
The Institute for Supply Management business activity index of the nonmanufacturing sector rose more than expected last month. A moderate increase had been expected.
New orders surged but employment fell. The employment component is about at its October level. The not seasonally adjusted price index rose slightly and it is well off its lows of last fall.
Business activity for the nonmanufacturing sector is a question separate from the components mentioned above. This is in contrast to the NAPM manufacturing sector composite index that reflects component activity.
During the last four years, there has been a 44% correlation between the level of the NAPM nonmanufacturing index and quarterly growth in real GDP in the service sector.
ISM surveys more than 370 purchasing managers in more than 62 industries, including construction, law firms, hospitals, government and retailers. The nonmanufacturing survey dates only to July 1997, therefore its seasonal adjustment should be viewed tentatively.
| ISM Nonmanufacturing Survey | Feb | Jan | Y/Y | 2001 | 2000 | 1999 |
|---|---|---|---|---|---|---|
| Business Activity Index | 58.7 | 49.6 | 52.4 | 49.0 | 59.2 | 59.1 |

Tom Moeller
AuthorMore in Author Profile »Prior to joining Haver Analytics in 2000, Mr. Moeller worked as the Economist at Chancellor Capital Management from 1985 to 1999. There, he developed comprehensive economic forecasts and interpreted economic data for equity and fixed income portfolio managers. Also at Chancellor, Mr. Moeller worked as an equity analyst and was responsible for researching and rating companies in the economically sensitive automobile and housing industries for investment in Chancellor’s equity portfolio. Prior to joining Chancellor, Mr. Moeller was an Economist at Citibank from 1979 to 1984. He also analyzed pricing behavior in the metals industry for the Council on Wage and Price Stability in Washington, D.C. In 1999, Mr. Moeller received the award for most accurate forecast from the Forecasters' Club of New York. From 1990 to 1992 he was President of the New York Association for Business Economists. Mr. Moeller earned an M.B.A. in Finance from Fordham University, where he graduated in 1987. He holds a Bachelor of Arts in Economics from George Washington University.
More Economy in Brief


