 Global| May 14 2007
Germany’s Retail Sales Flounder
Summary
German retail trends are hard to pin down. The German VAT tax that took effect in January of 2007 helped to bulge retail sales in December and to wither them in the following months. The three-month growth rate is particularly weak in [...]
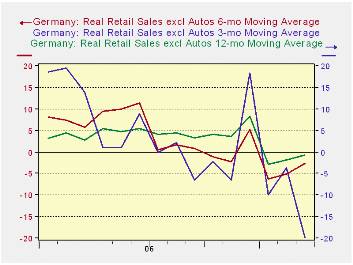
German retail trends are hard to pin down. The German VAT tax that took effect in January of 2007 helped to bulge retail sales in December and to wither them in the following months. The three-month growth rate is particularly weak in March, but that is because its base for the calculation is the elevated December level of sales. Even so, the Yr/Yr and six-month growth rates moved sharply lower in January and have stayed in a very weak growth plane.
March sales fell month to month. The March drop offset the sharp 1% gain in February that followed the 6.1% plunge in January. Sales declines were widespread in March. Auto sales were the contrary category with nominal sales up by a sharp 5.9% in March after rising by 7.1% in February. Autos seem to be recovering from their January plunge when sales fell by 30%.
Next month 3-mo sales should snap back strongly as 3-mo growth rates move their base to January the weaker from the strong December level. Even so that will not rid the six month and Yr/Yr growth from their weakness. While German retail sales are holding in, they are also much weaker than they were throughout 2006.
Officials remain upbeat on the prospects for growth in Germany. Early in the year results are mixed. Car sales alone are making a strong comeback but even they are lower by 2.7% Yr/Yr.
| Nominal | Mar-07 | Feb-07 | Jan-07 | 3-Mo | 6-Mo | 12-Mo | Year Ago |
| Retail Ex auto | -0.6% | 1.4% | -5.7% | -18.2% | -2.0% | -0.2% | 3.1% |
| Motor Vehicle and Parts | 5.9% | 7.1% | -30.2% | -60.7% | -17.8% | -2.7% | 8.2% |
| Food Beverages & Tobacco | -0.5% | -0.4% | -2.0% | -10.9% | -2.7% | -0.3% | 2.8% |
| Clothing & Footwear | -0.9% | 5.0% | -6.7% | -11.2% | 9.5% | 3.9% | 3.1% |
| Real | |||||||
| Retail excl Auto | -0.4% | 1.1% | -6.1% | -19.8% | -2.6% | -0.8% | 2.8% |
by Robert Brusca May 14, 2007
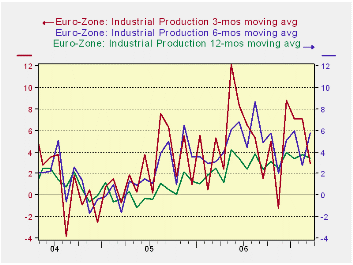
Industrial production in MFG in the Euro area in March rose by 0.3%. But the chart shows that a deceleration is underway. Yr/Yr growth is steady at just under 5.3%. But over the last three months output has lost momentum.
The table shows that consumer durables and capital equipment output weakened in March after a strong February showing, slowing the 3-month rate of growth sharply for overall production. Still, growth has only dropped off to a nearly 3% pace from 5% or more previously.
Key EMU countries continue to show strength. The three-month growth rates for output in Germany are still very strong at 8%, France’s 3.5% is a slight acceleration, while output has fallen off sharply in Italy declining at a 5.5% pace. In the UK three-month growth rates for output are negative for 3-mo and for 6-month horizons.
Capital equipment continues to be the leading sector. Consumer output is trailing and is showing no signs of pick up. 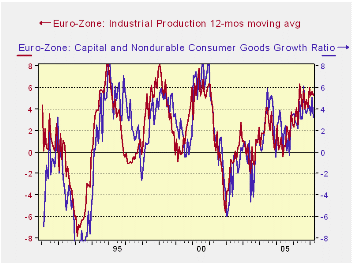
The ratio of capital goods output to consumer non-durables output is a directional signal for IP. Note how good the tracking is in the graph to the right. The capital goods sector is the leading sector for European economies. The R-square relationship of this ratio to overall IP growth is 0.67. That’s impressive for this type of indicator. For the moment, the ratio has stopped rising.
For the first quarter IP is still strong. MFG IP is growing at a 5.6% pace. The consumer sector is up at a 2.5% pace, intermediate goods at a 6% pace and capital goods at a 7.8% pace. But all may not continue to be so well…
The President of the EU business association, Business Europe, was quoted as saying on Monday that the strong euro was not causing a slowdown in the European economy. However, also on Monday the European Parliament issued a statement saying that upward trend in the Euro's exchange rate is not sustainable for the euro area's economy. Accordingly the Parliament’s draft report is to be debated in the Economic and Monetary Affairs Committee before being presented to ECB President Jean-Claude Trichet. Another interesting development was in the UK. There, Arm Holdings, the Cambridge-based designer of semiconductors, an industry whose global currency is dollars complained of an ongoing too-strong currency impact. Warren East, chief executive, estimates that the dollar has wiped £1bn from the company’s stock market value. He claims that the last ‘three years’ have been pretty horrid, not just the recent period when the pound and euro both have surged against the dollar. He maintains that seeking a cost base in the weaker dollar is the only solution. Surely, these observations are not compatible with a continuation of the strength we have seen in EU industrial output especially for capital equipment. We will be looking at the ratio of Capital goods IP to consumer nondurable goods IP as an indicator in the months ahead as well as at general IP trends.
| Saar except m/m | Mo/Mo | Mar-07 | Feb-07 | Mar-07 | Feb-07 | Mar-07 | Feb-07 | ||
| Ezone Detail | Mar-07 | Feb-07 | Jan-07 | 3-Mo | 3-Mo | 6-mo | 6-mo | 12-mo | 12-mo |
| MFG | 0.3% | 0.5% | -0.1% | 2.9% | 7.1% | 5.8% | 2.8% | 5.3% | 5.7% |
| Consumer | 0.6% | 0.0% | -0.3% | 1.1% | 3.0% | 4.0% | 2.0% | 3.3% | 2.5% |
| Consumer Durables | -0.2% | 0.6% | -1.5% | -4.2% | -0.1% | 2.7% | -3.5% | 3.9% | 5.0% |
| Consumer Nondurables | 0.7% | -0.1% | -0.2% | 1.5% | 3.6% | 4.1% | 2.3% | 3.1% | 2.1% |
| Intermediate | 0.5% | 0.7% | -0.6% | 2.4% | 9.2% | 7.0% | 1.4% | 6.3% | 7.2% |
| Capital | 0.0% | 0.9% | 0.3% | 5.0% | 8.2% | 6.7% | 5.5% | 6.4% | 7.3% |
| Memo: MFG | |||||||||
| Germany: | 0.3% | 0.8% | 1.0% | 8.8% | 7.7% | 8.0% | 6.7% | 8.6% | 8.1% |
| France: IP excl Construction | 0.2% | 1.2% | -0.5% | 3.5% | 7.2% | 3.3% | 1.6% | 1.1% | 2.5% |
| Italy | 0.4% | -0.2% | -1.6% | -5.5% | -0.8% | 4.0% | 0.2% | 2.5% | 2.2% |
| Spain | 1.9% | -5.2% | 9.3% | 24.2% | 2.3% | 12.8% | -1.8% | 3.1% | 5.3% |
| UK | 0.6% | -0.8% | -0.1% | -1.2% | -3.1% | -0.6% | -1.5% | 0.9% | 1.1% |
by Louise Curley May 14, 2007
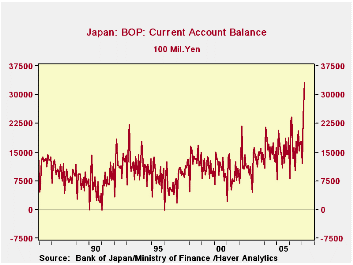
Japan's current account surplus on a seasonally unadjusted basis, was at an all time high in March at 3,317 billion yen, as can be seen in the first chart. The goods component of the surplus was 1,782.0 billion yen, and the income component, 1,837.9 billion yen. The 36.6 billion yen surplus on services was more than offset by a 339.4 billion yen deficit on transfers.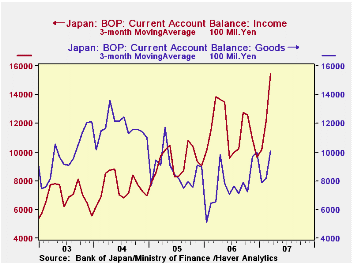
The surplus on income has become more important than the surplus on goods in the last two years, reflecting Japan's growing overseas investments. The second chart compares the three month moving averages of the goods and the income surpluses. The three month moving averages are used to mitigate some of the variation in the seasonally unadjusted data.
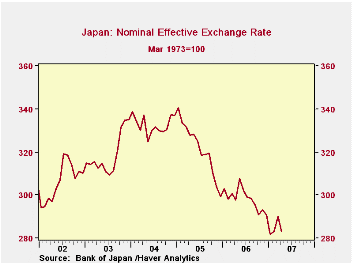
Exports of goods have been in a rising trend since 2002, with the most dynamic area in Asia. Currently, the dynamism in exports to Asia is largely responsible for the growth in total exports as exports to the United States, Europe and Central America have been more or less trend less, as shown in the third chart. A decline in the yen has contributed in part at least, to the recent growth in exports. The nominal effective exchange rate is shown in the fourth chart. This measure of the exchange rate has been declining since January, 2005 and is now 17% below that date.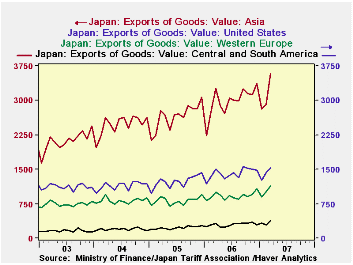
| JAPAN: BALANCE OF PAYMENTS (NSA, Billion Yen) |
Mar 07 | Feb 07 | Jan 07 | Mar 06 | Y/Y Dif | 2006 | 2005 | 2004 |
|---|---|---|---|---|---|---|---|---|
| Current Account | 3317.2 | 2407.5 | 1194.6 | 2422.3 | 984.9 | 19848.8 | 18259.1 | 18618.4 |
| Goods | 1782.0 | 1118.9 | 114.0 | 1094.5 | 682.5 | 9464.3 | 10334.5 | 13902.2 |
| Income | 1837.9 | 1462.6 | 1345.7 | 1623.8 | 214.1 | 13745.9 | 11381.6 | 9273.2 |
| Services | 36.6 | -70.1 | -192.5 | 25.5 | 11.1 | -2118.0 | -2641.8 | -3706.2 |
| Transfers | -339.4 | -93.8 | -72.8 | -326.5 | -12.9 | -1243.0 | -815.0 | -851.0 |
| Geographic Distribution of Export of Goods | ||||||||
| United States | 1539.6 | 1423.6 | 1254.2 | 1502.3 | 36.4 | 16933.6 | 14805.5 | 13730.7 |
| Europe | 1136.1 | 1010.6 | 893.4 | 1001.8 | 134.3 | 11045.5 | 9740.4 | 9789.5 |
| Central and South America | 384.4 | 288.2 | 333.3 | 319.3 | 65.0 | 3555.5 | 2760.0 | 2345.2 |
| Asia | 3587.0 | 2921.3 | 2807.9 | 3259.0 | 328.0 | 37775.6 | 31795.6 | 29636.8 |

Robert Brusca
AuthorMore in Author Profile »Robert A. Brusca is Chief Economist of Fact and Opinion Economics, a consulting firm he founded in Manhattan. He has been an economist on Wall Street for over 25 years. He has visited central banking and large institutional clients in over 30 countries in his career as an economist. Mr. Brusca was a Divisional Research Chief at the Federal Reserve Bank of NY (Chief of the International Financial markets Division), a Fed Watcher at Irving Trust and Chief Economist at Nikko Securities International. He is widely quoted and appears in various media. Mr. Brusca holds an MA and Ph.D. in economics from Michigan State University and a BA in Economics from the University of Michigan. His research pursues his strong interests in non aligned policy economics as well as international economics. FAO Economics’ research targets investors to assist them in making better investment decisions in stocks, bonds and in a variety of international assets. The company does not manage money and has no conflicts in giving economic advice.
More Economy in Brief


