 Global| Apr 04 2008
German Orders Fall in January andFebruary - Is Euro to Blame?
Summary
German foreign orders is a very volatile series – even when expressed as Yr/Yr gains. While both the domestic and foreign orders series are ragged, each shows a tendency for orders growth to decelerate (see graph). Foreign orders are [...]
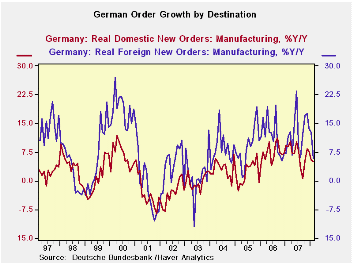
German foreign orders is a very volatile series – even when expressed as Yr/Yr gains. While both the domestic and foreign orders series are ragged, each shows a tendency for orders growth to decelerate (see graph). Foreign orders are off especially sharply but the series is so volatile it is difficult to know what to make of the drop off.
The drop off in the quarter to date (two months out of three) shows total orders off at a 4.8% pace, foreign orders off at a 9.9% pace and domestic orders UP at a 1.1% pace.
The message in the foreign/domestic split is that the weakness is being imported. Further, the foreign orders from outside the Euro Area are the weakest portion of foreign orders. That places the blame for weakness back on the strong euro.
Still, the trends for both domestic and foreign orders are clearly lower and become weaker as the sequential data in the table tells us. And Germany has been one of the strongest economies in the Euro Area and it is the largest Euro Area member economy. The weakening in this key economy’s orders is something to be wary of since so far the service sector data have been weaker than the Manufacturing sector which now seems to be emitting new weakening signs of its own.
| German Orders and Sales By Sector and Origin | |||||||
|---|---|---|---|---|---|---|---|
| Real and SA | % M/M | % Saar | |||||
| Feb-08 | Jan-08 | Dec-07 | 3-Mo | 6-Mo | 12-Mo | YrAgo | |
| Total Orders | -0.5% | -0.7% | -1.2% | -9.3% | -4.7% | 5.4% | 10.4% |
| Foreign | -1.1% | -0.4% | -2.3% | -14.2% | -7.4% | 5.7% | 11.7% |
| Domestic | 0.0% | -0.9% | -0.1% | -3.7% | -1.9% | 5.1% | 8.9% |
| Sector Sales | |||||||
| MFG/Mining | 0.1% | 2.1% | 1.0% | 13.3% | 6.4% | 6.4% | 7.7% |
| Consumer Goods | -1.2% | 1.0% | -0.1% | -1.1% | -0.6% | 0.6% | 3.2% |
| Consumer Durables | -0.9% | 0.8% | 1.0% | 3.8% | 1.9% | -0.2% | 5.1% |
| Consumer Nondurables | -1.4% | 1.1% | -0.4% | -2.6% | -1.3% | 0.7% | 2.7% |
| Capital Goods | -0.6% | 4.2% | 0.8% | 19.1% | 9.2% | 9.8% | 7.8% |
| Intermediate Goods | 1.5% | 0.2% | 1.6% | 14.0% | 6.7% | 5.6% | 10.2% |
| All Manufacturing Sales | -0.1% | 2.1% | 1.1% | 13.1% | 6.3% | 6.1% | 7.2% |
by Tom Moeller April 4, 2008
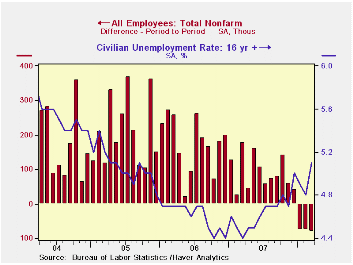
For the third consecutive month the Bureau of Labor Statistic reported that nonfarm payrolls fell. The 80,000 worker decline in March was the largest of the three and the two prior months' declines were revised deeper from the initial reports. Expectations had been for a 53,000 worker decline in March payrolls.
Has economic recession begun? When the job figures are combined with a roughly stable level of hours worked, the level of aggregate hours (employment times hours) fell in two of the last three months and fell at an annual rate of 1.2% during 1Q. Over the last thirty years there has been a 76% correlation between the q/q change in aggregate hours worked and the change in real GDP. The 25% that is left out of that correlation reflects productivity growth and during the last three years it rose between 1.0% and 2.0%. When aggregate hours and productivity are added they suggest no growth or even a slight decline in 1Q real GDP.
From the household sector survey the unemployment
rate rose to 5.1%, its highest level since May of 2005. Job
creation did not keep up with growth in the labor force. Household
employment declined by 24,000 (-0.1% y/y) and jobs declined irregularly
in each month since early last year. The labor force, conversely, rose
410,000 last month. The annual rate of gain fell to 0.6% from 1.9%
early last year. Individuals who stopped looking for work did so at a
1.4% y/y rate in March, up from a zero rate of change at the end of
2006.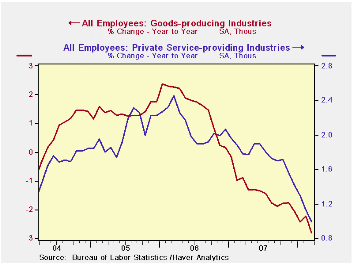
From the establishment survey, aside from continued growth in government sector jobs (+1.1% y/y), the figures for private nonfarm payrolls painted a distressing picture of the job market. Private sector payrolls fell 98,000 in March. It was the fourth consecutive monthly decline and it followed a 109,000 drop in February. While the y/y change in private payrolls still was a positive 0.3%, recent momentum as indicated by the three month change, fell to a negative 1.0% (AR).
Factory sector job loss intensified last month to a 48,000 decline, nearly the largest monthly drop since 2003. The three month rate of job loss deepened to -3.7%, also its fastest since 2003.
Construction sector employment declines continued to
accelerate. The m/m decline of 51,000 was the largest in nearly a year
and the three month growth rate stood at -6.6%, near its lowest since
late 1991.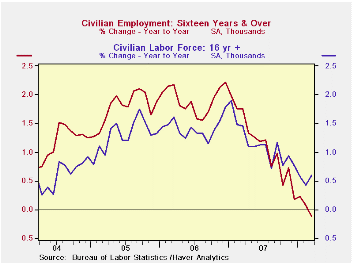
Hiring in the private service sector was more distressing given its norm of positive job growth. Jobs in retail trade fell for the sixth month in the last seven and the three month rate of change deepened to -1.9%. Professional & business services jobs fell for the third straight month and the three month rate of change was -2.1%. Temporary help services jobs again was quite weak and fell 21,600 pulling three month growth to -8.9% (AR). Jobs here have been declining for more than a year. Employment in finance dropped by 5,000 and they're down 1.5% from the late 2006 peak. Weakness in the real estate sector jobs fell 4,200 job last month and at a 3.6% rate over the last three months.
Just as during February, the March employment figures contained an indicator which portended even further weakness in overall job creation. The one month diffusion index, which measures the breadth of job gain or loss (50 is the break even level), indicated loss at 47.7%. The three month index was an even weaker 42.9% which was its lowest since 2003.
Average hourly earnings rose a very steady 0.3%. Factory sector earnings rose 0.2% (2.9% y/y) and private service-providing earnings rose 0.3% (4.1% y/y) for the second month.
The average duration of unemployment fell slightly to 16.2
weeks from 16.8 in February. Those figures are down from the averages
of the prior several years.
Central Bank Commitment and Communication is yesterday's speech by Fed GovernorFrederic S. Mishkin and it can be found here.
| Employment: 000s | March | February | January | Y/Y | 2007 | 2006 | 2005 |
|---|---|---|---|---|---|---|---|
| Payroll Employment | -80 | -76 | -76 | 0.4% | 1.1% | 1.8% | 1.7% |
| Previous | -- | -63 | -22 | -- | 1.3% | 1.9% | 1.7% |
| Manufacturing | -48 | -46 | -35 | -2.2% | -1.9% | -0.5% | -0.6% |
| Construction | -51 | -37 | -39 | -4.6% | -1.0% | 4.9% | 5.2% |
| Average Weekly Hours | 33.8 | 33.7 | 33.7 | 33.9 (Mar'07) | 33.8 | 33.9 | 33.8 |
| Average Hourly Earnings | 0.3% | 0.3% | 0.3% | 3.6% | 4.0% | 3.9% | 2.7% |
| Unemployment Rate | 5.1% | 4.8% | 4.9% | 4.4% (Mar'07) | 4.6% | 4.6% | 5.1% |

Robert Brusca
AuthorMore in Author Profile »Robert A. Brusca is Chief Economist of Fact and Opinion Economics, a consulting firm he founded in Manhattan. He has been an economist on Wall Street for over 25 years. He has visited central banking and large institutional clients in over 30 countries in his career as an economist. Mr. Brusca was a Divisional Research Chief at the Federal Reserve Bank of NY (Chief of the International Financial markets Division), a Fed Watcher at Irving Trust and Chief Economist at Nikko Securities International. He is widely quoted and appears in various media. Mr. Brusca holds an MA and Ph.D. in economics from Michigan State University and a BA in Economics from the University of Michigan. His research pursues his strong interests in non aligned policy economics as well as international economics. FAO Economics’ research targets investors to assist them in making better investment decisions in stocks, bonds and in a variety of international assets. The company does not manage money and has no conflicts in giving economic advice.
More Economy in Brief


