 Global| Dec 08 2008
German Industrial Output Trends isWeaker Than Expectedly
Summary
German industrial output fell by 2.1% in October and its sequential growth rates show a steady drumbeat of negativism more than an acceleration of weakness. This is in stark contrast to the unraveling in orders. But order weakness [...]
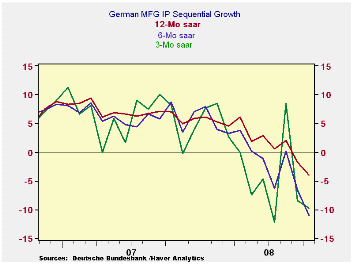
German industrial output fell by 2.1% in October and its
sequential growth rates show a steady drumbeat of negativism more than
an acceleration of weakness. This is in stark contrast to the
unraveling in orders. But order weakness always takes several months to
become embedded in the behavior of output so the steadier path of
output is not much in which to take solace. Finally it is the consumer
sector that it showing some resiliency. But capital goods and
intermediate goods industry output each show persisting deep if not
accelerating declines in output. With the economic crisis spreading
this resiliency by consumers will not be long lived. MFG IP shows
relatively more weakness. And orders are pointing the way much lower.
| Total German IP | |||||||
|---|---|---|---|---|---|---|---|
| Saar except m/m | Oct-08 | Sep-08 | Aug-08 | 3-mo | 6-mo | 12-mo | Quarter-to-Date |
| IP total | -2.1% | -3.3% | 3.2% | -8.7% | -10.5% | -3.9% | -17.8% |
| Consumer Goods | -0.4% | -2.3% | 3.5% | 2.8% | -1.6% | -3.4% | -4.8% |
| Capital Goods | -3.1% | -3.1% | 3.7% | -10.1% | -14.6% | -4.6% | -21.4% |
| Intermediate Goods | -2.2% | -4.6% | 2.9% | -15.3% | -11.6% | -3.4% | -23.5% |
| Memo | |||||||
| Construction | -3.0% | -3.0% | 6.4% | 0.5% | -5.1% | -4.3% | -16.5% |
| MFG IP | -2.2% | -3.6% | 3.3% | -9.8% | -11.0% | -3.9% | -19.2% |
| MFG Orders | -6.1% | -8.3% | 3.5% | -36.8% | -28.3% | -17.3% | -48.2% |
by Louise Curley December 8, 2008
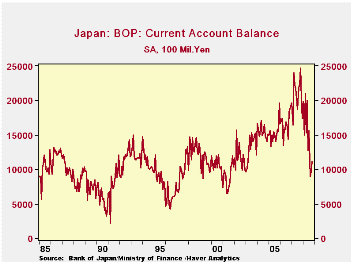
Japan's current account balance has deteriorated severely this year. The balance for the first 10 months of 2008 was a surplus 14,943 billion yen, compared with 21,206 billion yen surplus in the comparable period of 2007, a decline of 30%. The first chart puts the magnitude of the decline in perspective.(We express the values in terms of billion yen, rather than the 100 million yen shown in the balance of payments data in Haver's JAPAN Data Base and in the attached charts)
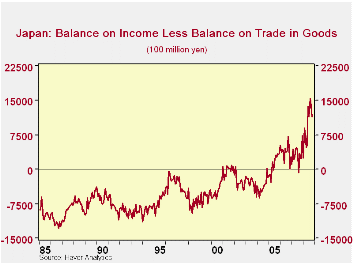
Traditionally, Japan has had negative balances on Services and Transfers and positive balances on Income and Goods. The second chart shows these balances over the past twenty-three years. The deficit in the balance on services has tended to be less negative, and the balance on income has become more positive but it is clear from this chart that the major cause of the recent steep decline in the current account balance is the decline in the balance on goods. So steep has been the decline that in August and September, the customary surpluses on trade in goods turned into deficits.

| JAPAN CURRENT ACCOUNT BALANCE | Oct 08 | Sep 08 | Oct 07 | M/M chg | Y/Y chg | 2007 | 2006 | 2005 |
|---|---|---|---|---|---|---|---|---|
| Current Account Balance (Bil.Yen) | 1113.2 | 920.5 | 2471.5 | 142.7 | -1258.3 | 24971 | 20030 | 18353 |
| Balance on Goods (Bil.Yen) | 118.3 | -76.6 | 1233.2 | 194.9 | 1114.9 | 12467 | 9430 | 10217 |
| Balance on Income (Bil.Yen) | 1266.1 | 1307.0 | 1471.7 | -40.9 | -205.6 | 16341 | 13960 | 11592 |
| Balance on Services (Bil.Yen) | -136.8 | -169.0 | -135.4 | 32.2 | -1.4 | -2476 | -2126 | -2643 |
| Balance on Transfers (Bil.Yen) | -134.3 | -91.0 | -97.9 | -43.3 | -36.4 | -1362 | -1234 | -813 |

Robert Brusca
AuthorMore in Author Profile »Robert A. Brusca is Chief Economist of Fact and Opinion Economics, a consulting firm he founded in Manhattan. He has been an economist on Wall Street for over 25 years. He has visited central banking and large institutional clients in over 30 countries in his career as an economist. Mr. Brusca was a Divisional Research Chief at the Federal Reserve Bank of NY (Chief of the International Financial markets Division), a Fed Watcher at Irving Trust and Chief Economist at Nikko Securities International. He is widely quoted and appears in various media. Mr. Brusca holds an MA and Ph.D. in economics from Michigan State University and a BA in Economics from the University of Michigan. His research pursues his strong interests in non aligned policy economics as well as international economics. FAO Economics’ research targets investors to assist them in making better investment decisions in stocks, bonds and in a variety of international assets. The company does not manage money and has no conflicts in giving economic advice.
More Economy in Brief


