 Global| Dec 19 2007
Gasoline Still Near $3.00 per Gallon. Longer Term, Less is Used
by:Tom Moeller
|in:Economy in Brief
Summary
On average, retail gasoline prices last week held at the prior period's level of $3.00 per gallon, according to the US Department of Energy survey.That level is, however, down eleven cents from the peak one month ago. The recent [...]
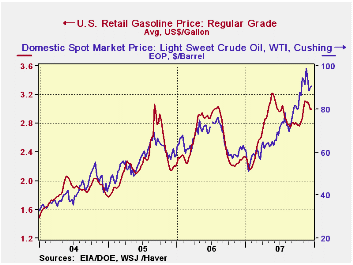
On average, retail gasoline prices last week held at the prior period's level of $3.00 per gallon, according to the US Department of Energy survey.That level is, however, down eleven cents from the peak one month ago.
The recent stability of gasoline prices owes to the decline in the price of crude oil. For spot WTI crude oil, prices at $90.00 per barrel are down almost 10% from the highs last month which nearly touched $100 per barrel.
That stability, however, is little comfort at the pump where prices have doubled versus the $1.56 averaged during 2003. To drive 10,000 miles in a vehicle which averages 20 miles per gallon, the annual cost has risen to $1,500 from $750.
At the margin, where spending decisions are made, persons
earning $30,000 per year now will now spend 5% of yearly income on
gasoline versus 2.5% in 2003. Since then the demand for gasoline indeed
has fallen, but only modestly to 2.3% of real consumer expenditures
from 2.5%. Bottom line: less will be available for spending on other
goods & services.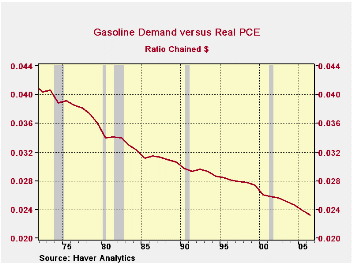
Longer term trends paint a somewhat less gloomy picture for two reasons. 1) As a percentage of total consumer spending, that percentage spent on gasoline is down by nearly one half since before oil prices quadrupled in the mid 1970s, and 2) versus all other consumer prices gasoline has risen sharply, yet only to the level of the early 1980s.
Less demand for gasoline only is perhaps a saving grace for this picture. Had vehicle fuel efficiency not roughly doubled to that 20 miles per gallon, annual fuel costs would be $3,000. Ouch. That's still a doubling.
Relative to all other consumer prices, gasoline indeed has risen. Ouch. In fact, the rise rivals the gain of 25-30 years ago. A saving grace, perhaps; the level prices have risen to is still below the high seen in 1980. (That's only a positive if a person was born before 1963.)
Other factors also do mitigate the negative effects of the
recent rise in gasoline prices. Disposable income growth is now
accelerating versus decelerating in earlier periods of oil price
shocks. And even though employment growth is recently down, the
deceleration is nowhere near as dramatic as in earlier periods. And the
unemployment rate is lower. Finally, interest rates are quite a bit
lower.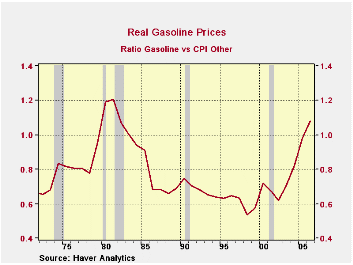
That all, makes it quite uncertain how consumer will/is holding up. The data are inconclusive, so far. Anecdotal reports are mixed. Chain store sales are easing. Vehicle sales are flat to lower. (All of the data used in this analysis is available in Haver's USECON and USWEEKLY data bases.)
Oil Shocks and Price Stability from the Federal Reserve Bank of St. Louis is available here.
Today's announcement by the Fed of recent auction result can be found here.
| Weekly Prices | 12/17/07 | 12/10/07 | Y/Y | 2006 | 2005 | 2004 |
|---|---|---|---|---|---|---|
| Retail Gasoline ($ per Gallon) | 3.00 | 3.00 | 29.2% | 2.57 | 2.27 | 1.85 |
| Light Sweet Crude Oil, WTI ($ per bbl.) | 90.03 | 88.33 | 47.5% | 61.11 | 58.16 | 41.78 |
by Robert Brusca December 19, 2007
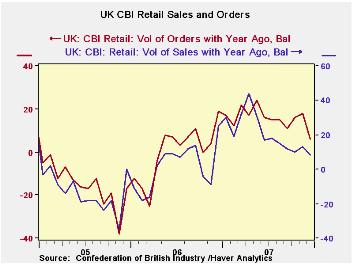
It’s telling when an organization like the CBI says that the
expected January reading of -5 still corresponds to an annual volume
increase of 2.5%. But the result of December is the weakest in a bit
over one year (since Nov 2006). The expected sales for January are the
weakest since April of 2006. This is not Draconian weakness but then a
look at the plots in this report and an application of the
ever-reliable straight-edge forecast rule gives an idea of where we
might yet be headed. Then again, straight edge forecasts are always
wrong at some point, the only question is: when? Soon or later on? For
the moment, momentum is gone and financial fragility – or even turmoil
- is still with us. The BOE is worried enough to have cut rates even
with a forecast that sees an inflation overshoot into 2008. In an era
when the central banking mantra is "cement and anchor inflation
expectations", this is indeed a bold step by the central bank. Of
course the times are odd since there is even talk from the PM himself
that doesn't rule out a nationalization of Northern Rock. The times
they are a-changin’, aren’t they?
The level of the readings in the chart make a telling
comparison with where they have been in the previous two years and THE
LEVELS speak of current strength -- or better put -- current momentum.
But the steadiness of the slippage is yet another signal and it forms a
dark side of that momentum that sounds a warning for the times ahead.
The expectations for sales and orders in January are off sharply from
December and in truth it is hard to know what to pencil in for February
and that is the number that policy must look to at the moment to sort
out the mess. Is January a rogue and outsized drop? Will February
reverse it? Will February worsen on trend? These are things we do not
know, and as Inspector Clouseau of Pink Panther fame reminds us: ‘we do
not know what we do not know’. So policy must have its hunch and make
its deal with the devil. The question is, of course, which devil? The
CBI report is decidedly mixed and the trend is a call to action. But it
is not clear that the BOE has the wherewithal to answer it, despite
having cut rates once already. It is also far from clear what action is
called for.
| UK Retail volume data CBI Survey | |||||||||
|---|---|---|---|---|---|---|---|---|---|
| Reported: | Jan-08 | Dec-07 | Nov-07 | Oct-07 | 12Mo Avg | Pcntle | Max | Min | Range |
| Sales/Year Ago | -- | 8 | 13 | 10 | 21 | 47% | 57 | -35 | 92 |
| Orders/Year Ago | -- | 6 | 18 | 16 | 16 | 55% | 42 | -38 | 80 |
| Sales:Time/Yr | -- | -5 | -3 | 0 | 5 | 41% | 41 | -37 | 78 |
| Stocks: Sales | -- | 24 | 18 | 13 | 13 | 80% | 30 | 0 | 30 |
| Expected: | |||||||||
| Sales/Yr Ago | -5 | 11 | 15 | 16 | 17 | 25% | 49 | -23 | 72 |
| Orders/Yr Ago | -9 | 10 | 12 | 16 | 12 | 35% | 38 | -34 | 72 |
| Sales:Time/Yr | -16 | 3 | 2 | -9 | 4 | 22% | 29 | -29 | 58 |
| Stocks: Sales | 24 | 11 | 12 | 5 | 10 | 100% | 24 | 3 | 21 |
by Robert Brusca December 19, 2007
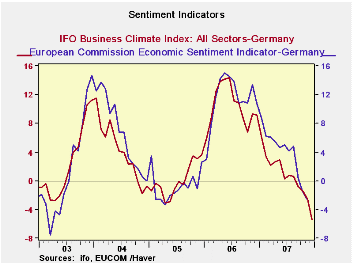
The IFO index for December is out, but the detail awaits
releases next week. The headlines and sector news tell us what we
already knew and that is, conditions are still deteriorating. The
Business climate and Current situation indices are still firm-valued as
they reside at or near the three-quarters mark of their respective
ranges. The outlook index is less upbeat as it resides at the one-third
mark. If we were assigning grades it would be 'Cs’ for climate and
current and a ‘D’ for expectations. The IFO gauge has slipped more
rapidly that it did in the 2005 episode.
| IFO Survey: Germany | ||||||||
|---|---|---|---|---|---|---|---|---|
| Percent: Yr/Yr | INDEX NUMBERS | |||||||
| Dec-07 | Nov-07 | Oct-07 | Sep-07 | Aug-07 | Current | Average | Percentile | |
| Biz Climate | -5.3% | -2.5% | -1.4% | -0.9% | 0.7% | 103.0 | 95.8 | 75.6% |
| Current Situation | -6.2% | -3.2% | -2.1% | -1.3% | 2.5% | 108.1 | 94.9 | 77.6% |
| Biz Expectations | -4.3% | -2.0% | -0.8% | -0.4% | -1.1% | 98.2 | 96.7 | 66.8% |
by Robert Brusca December 19, 2007
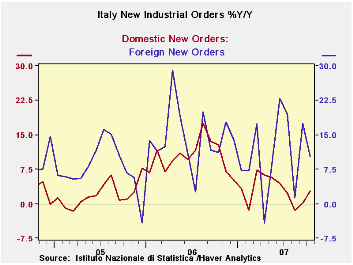
Italy’s new orders are off in October, led by weakness in
foreign orders on the month. But that drop only offsets the rise the
month before. Domestic order weakness remains despite the 1.7% rise in
October. Over three months both domestic and foreign orders are
falling. Yr/Yr foreign order growth is still strong at +10.2%, while
domestic orders are up by just 2.9% over 12-months. In the quarter to
date, total orders are dropping at a 6.3% pace, while foreign orders
are dropping at a 19% rate. Domestic orders in Q4 2007 are edging
upward a pace of 1.9% at an annualized rate.
| Italy Orders | ||||||
|---|---|---|---|---|---|---|
| Saar except m/m | Oct-07 | Sep-07 | Aug-07 | 3-mo | 6-mo | 12-mo |
| Total | -1.1% | 0.3% | -0.7% | -5.7% | 6.3% | 5.3% |
| Foreign | -5.6% | 5.6% | -4.1% | -16.3% | 12.5% | 10.2% |
| Domestic | 1.7% | -2.6% | 1.2% | 1.1% | 3.0% | 2.9% |
| Memo | ||||||
| Sales | -0.5% | -3.6% | 3.9% | -1.3% | 5.6% | 3.7% |

Tom Moeller
AuthorMore in Author Profile »Prior to joining Haver Analytics in 2000, Mr. Moeller worked as the Economist at Chancellor Capital Management from 1985 to 1999. There, he developed comprehensive economic forecasts and interpreted economic data for equity and fixed income portfolio managers. Also at Chancellor, Mr. Moeller worked as an equity analyst and was responsible for researching and rating companies in the economically sensitive automobile and housing industries for investment in Chancellor’s equity portfolio. Prior to joining Chancellor, Mr. Moeller was an Economist at Citibank from 1979 to 1984. He also analyzed pricing behavior in the metals industry for the Council on Wage and Price Stability in Washington, D.C. In 1999, Mr. Moeller received the award for most accurate forecast from the Forecasters' Club of New York. From 1990 to 1992 he was President of the New York Association for Business Economists. Mr. Moeller earned an M.B.A. in Finance from Fordham University, where he graduated in 1987. He holds a Bachelor of Arts in Economics from George Washington University.
More Economy in Brief


