 Global| Apr 07 2009
Gasoline Prices Hold Prior Weeks'Gains
by:Tom Moeller
|in:Economy in Brief
Summary
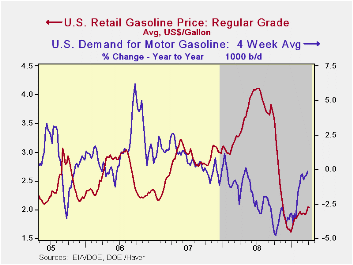
Regular gasoline prices last week held firm at $2.04 per gallon, the highest level since last November. The latest was up 42 cents from the December low. Yesterday, the spot market price for regular gasoline also remained firm at [...]
 Regular
gasoline prices last week held firm at $2.04 per gallon, the
highest level since last November. The latest was up 42 cents from the
December low. Yesterday, the spot market price for regular gasoline
also remained firm at $1.37 per gallon. That was roughly unchanged from
the prior two weeks but up from under $1.00 at the end of last year.
The figures are reported by the U.S. Department of Energy.
Regular
gasoline prices last week held firm at $2.04 per gallon, the
highest level since last November. The latest was up 42 cents from the
December low. Yesterday, the spot market price for regular gasoline
also remained firm at $1.37 per gallon. That was roughly unchanged from
the prior two weeks but up from under $1.00 at the end of last year.
The figures are reported by the U.S. Department of Energy.
Weekly gasoline prices can be found in Haver's WEEKLY database. Daily prices are in the DAILY database.
Crude oil 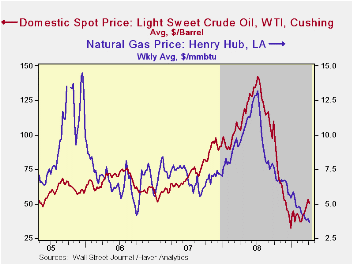 prices backpedaled from their
earlier high as
estimates of crude oil production strengthened. The American Petroleum
Institute indicated that production rose in the latest week by 7.8%
y/y. That increase compares with a decline in crude oil production of
2.1% during all of last year. Inventories of crude oil also were
strong, as estimated by DOE's Energy Information Association.
Inventories rose 15.6% following the 9.0% increase in 2008. The
inventory and production figures lowered the price for a barrel of West
Texas Intermediate to $50.32 from the recent high of $53.09. However,
that remained up more than 50% from the December low of $32.37 per
barrel. In futures trading the May contract price for crude oil fell
back yesterday to a still firm $51.05 per barrel. Prices reached a high
of $145.66 last July.
prices backpedaled from their
earlier high as
estimates of crude oil production strengthened. The American Petroleum
Institute indicated that production rose in the latest week by 7.8%
y/y. That increase compares with a decline in crude oil production of
2.1% during all of last year. Inventories of crude oil also were
strong, as estimated by DOE's Energy Information Association.
Inventories rose 15.6% following the 9.0% increase in 2008. The
inventory and production figures lowered the price for a barrel of West
Texas Intermediate to $50.32 from the recent high of $53.09. However,
that remained up more than 50% from the December low of $32.37 per
barrel. In futures trading the May contract price for crude oil fell
back yesterday to a still firm $51.05 per barrel. Prices reached a high
of $145.66 last July.
The figures on crude oil production and inventories are available in Haver's Weekly Oil Statistics database.
Gasoline demand last week fell 0.2% y/y
versus the 4.8% rate of decline seen last October. (Gasoline prices at
the time were just off their peak.) The change in demand is measured
using the latest four weeks versus the same four weeks in 2008. Demand
for all 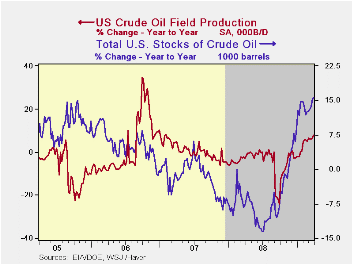 petroleum products was down 4.4% y/y. That
negative comparison was led by a 9.1% decline in distillate demand.
Demand for residual rose a modest 1.2%. These numbers are available in
Haver's OILWKLY database.
petroleum products was down 4.4% y/y. That
negative comparison was led by a 9.1% decline in distillate demand.
Demand for residual rose a modest 1.2%. These numbers are available in
Haver's OILWKLY database.
The price of natural gas continued downward with the coming end to the winter heating season. Prices fell to $3.64 per mmbtu (-61.7% y/y) which was near the lowest level since 2002. The latest average price was down more than two-thirds from the high reached in early-July of $13.19/mmbtu.
The Panic of 2008 is the title of yesterday's speech by Fed Governor Kevin Warsh and it can be found here.
| Weekly Prices | 04/06/09 | 03/30/09 | Y/Y | 2008 | 2007 | 2006 |
|---|---|---|---|---|---|---|
| Retail Regular Gasoline ($ per Gallon, Regular) | 2.04 | 2.05 | -38.9% | 3.25 | 2.80 | 2.57 |
| Light Sweet Crude Oil, WTI ($ per bbl.) | 50.32 | 53.09 | -51.4% | 100.16 | 72.25 | 66.12 |
by Tom Moeller April 7, 2009
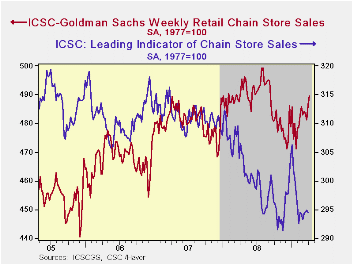
After a weak March, the consumer may be showing signs of returning to the stores. The International Council of Shopping Centers-Goldman Sachs Index indicated that sales in early April rose 0.6% after the 1.1% jump during the prior week. As a result, sales began this month 1.2% above the March average following that month's tepid 0.3% uptick.
The ICSC-Goldman Sachs retail chain-store sales index is constructed using the same-store sales (stores open for one year) reported by 78 stores of seven retailers: Dayton Hudson, Federated, Kmart, May, J.C. Penney, Sears and Wal-Mart.
During the last ten years there has been a 64% correlation between the year-to-year growth in chain store sales and the growth in general merchandise sales. These weekly figures are available in Haver's SURVEYW database.
The outlook for sales continued cautiously optimistic. The leading indicator of sales has been moving sideways since early February.
| ICSC-UBS (SA, 1977=100) | 04/03/09 | 03/27/09 | Y/Y | 2008 | 2007 | 2006 |
|---|---|---|---|---|---|---|
| Total Weekly Chain Store Sales | 489.5 | 486.5 | -0.3% | 1.4% | 2.8% | 3.3% |
by Tom Moeller April 7, 2009
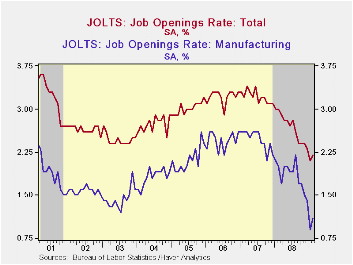
For February, the Bureau of Labor Statistics reported in its Job Openings & Labor Turnover Survey (JOLTS) that job availability made up just a piece of the January decline. The 2.9% rise in the number of job opening followed a 9.4% January falloff and openings remained off by roughly one-third from the year ago level. The latest level remained near the record low for the series which dates back to December 2000.
The job openings rate also rose modestly in February to 2.2% versus a downwardly revised 2.1% rate in January. These rates were down from more than a 3% rate in 2007. The job openings rate is the number of job openings on the last business day of the month as a percent of total employment plus job openings.
The actual number of job openings in the construction sector
fell by 81% from the year ago level and factory sector job openings
fell 50%, as did leisure & hospitality jobs
which also were off by 50%. Professional & business services
job openings fell more than one-third year-to-year while openings in
the education & health sectors also were off by nearly one
quarter. Openings in retail trade fell a slight 6% y/y. Not only were
private sector openings down but government sector job openings fell a
sharp 12% with state & local off 17% as tax revenues fell.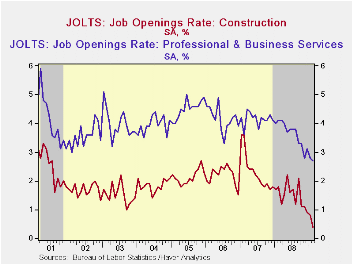
By region, openings in the West fell the hardest, by 42% year-to-year, while openings in the South and the Midwest were off roughly 30%. Openings in the Northeast they were down by a more moderate 12%.
The hires rate held steady for the third month at 3.3% and that was near the lowest in the series' short eight year history.The hires rate is the number of hires during the month divided by employment.The actual number of hires fell by 13% year-to-year with the largest declines coming in the leisure & hospitality industry (-25%) followed by the factory sector (-23%) and the retail sector (-22%). In the professional & business services industry the decline was a more moderate 11% while education & health services jobs fell 8%. Construction sector hires fell 2%.
The job separations rate fell slightly to 3.6%, about where it's been since early 2008. Separations include quits, layoffs, discharges, and other separations as well as retirements. The level of job separations fell 3.5% y/y.
The JOLTS survey dates only to December 2000 but has followed the movement in nonfarm payrolls, though the actual correlation between the two series is low.
A description of the Jolts survey and the latest release from the U.S. Department of Labor is available here and the figures are available in Haver's USECON database.
| JOLTS (Job Openings & Labor Turnover Survey) | February | January | February '08 | 2008 | 2007 | 2006 |
|---|---|---|---|---|---|---|
| Job Openings, Total | ||||||
| Rate (%) | 2.2 | 2.1 | 3.0 | 2.3 | 3.1 | 3.3 |
| Total (000s) | 3,006 | 2,920 | 4,248 | 3,224 | 4,382 | 4,606 |
| Hires, Total | ||||||
| Rate (%) | 3.3 | 3.3 | 3.7 | 41.1 | 46.1 | 47.6 |
| Total (000s) | 4,360 | 4,460 | 5,035 | 56,486 | 63,666 | 64,879 |
by Tom Moeller April 7, 2009
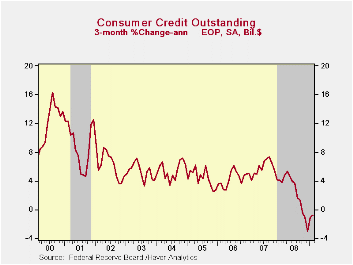
For February the Federal Reserve reported that consumer credit
outstanding fell $7.4B. As a result of the decline, which was the fifth
since July, credit growth slowed to just 1.1% year-to-year which was
the weakest since late 1992. On a three-month basis credit outstanding
has followed the decline in retail spending and fallen at a 0.8% annual
rate.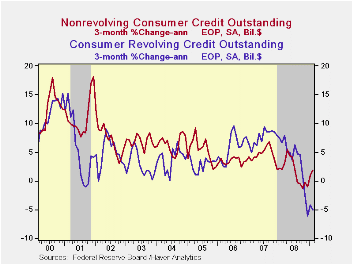
Non-revolving credit (autos & other consumer durables), which accounts for nearly two-thirds of the total, ticked up just $0.3B in February. However, it rose at a 1.9% rate over the last three months, a pickup from the negative growth at the end of last year. Usage of revolving credit fell a huge $7.8B in February which was a record. The decline lowered three-month growth to a negative 5.1% which was near the record.
These figures are the major input to the Fed's quarterly Flow of Funds accounts for the household sector.
Credit data are available in Haver's USECON database. The Flow of Funds data are in Haver's FFUNDS database.
Credit Storm Sinking Global Trade from the Federal Reserve Bank of Atlanta can be found here.
| Consumer Credit (m/m Chg, SAAR) | February | January | Y/Y | 2008 | 2007 | 2006 |
|---|---|---|---|---|---|---|
| Total | $-7.4B | $8.1B | 1.1% | 1.8% | 5.5% | 4.5% |
| Revolving | $-7.8B | $1.9B | 0.5% | 2.4% | 7.4% | 6.1% |
| Non-revolving | $0.3B | $6.2B | 1.4% | 1.4% | 4.4% | 3.6% |
by Louise Curley April 7, 2009
The Bank of Australia reduced its benchmark interest rate from
3.25% to 3.00% today. This marks a 525 basis point reduction from the
8.25% rate in June, 2008. Growth in the Australian economy virtually
came to a halt in the third quarter of 2008 when GDP increased by 0.08%
and disappeared in the fourth quarter when GDP declined by 0.53%. In
February of this year, the Australian government announced a A$42
billion (3.5% of GDP) stimulus program of cash disbursements and
infrastructure spending.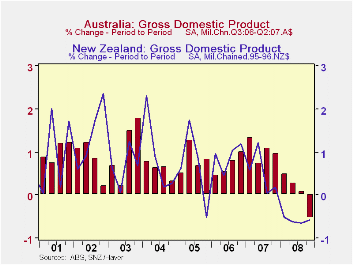
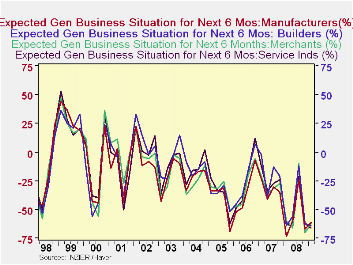
NZIER (New Zealand Institute of Economic Research) published
its quarterly survey of business opinion today. The results are shown
as percent balances between those expecting improvement in the economy
over next six months and those expecting a deterioration. The overall
opinion is based on the opinions of manufacturers, builders, merchants
and those engaged in the service industries. In the latest survey, the
overall, or economy wide, balance of opinion was -65% meaning that
there were 65% more pessimists than optimists. There is a great deal of
volatility in the opinions of the participants in the survey but also a
clear down ward trend as can be seen in the first chart. In the latest
survey, there was a slightly less negative balance for the manufactures
and the merchants and a slightly more negative for the builders and
those engaged in the service industries.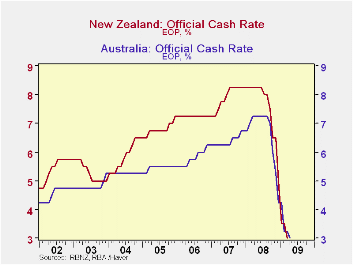
New Zealand's economy has been weaker than that of Australia
as can be seen in the second chart that shows the quarterly changes in
real GDP for the two countries. In New Zealand, GDP declined throughout
2008 and for the year as a whole was 1.0% below 2007. In Australia, GDP
did not decline until the fourth quarter and for the year 2.1% above
2007. The quarterly changes in real GDP in New Zealand and Australia
are shown in the second chart. The third chart shows the official
policy interest rates for both countries.New Zealand has, until
recently, had a higher benchmark interest rate than Australia, largely
as a result of New Zealand's large current account deficit, which has
been running between 8 and 9% of GDP for the past few years.
| AUSTRALIA & NEW ZEALAND | Q1 09 | Q4 08 | Q3 08 | Q2 08 | Q1 08 | 2008 CHG% | 2007 |
|---|---|---|---|---|---|---|---|
| GDP % Change | |||||||
| Australia | -- | -0.53 | 0.08 | 0.28 | 0.49 | 2.06 | 4.02 |
| New Zealand | -- | -0.57 | -0.65 | -.061 | -.052 | -0.97 | 3.12 |
| NZIER (% Balance) | |||||||
| Manufacturers | -61 | -67 | -24 | -60 | -73 | -- | -- |
| Builders | -64 | -62 | -12 | -56 | -64 | -- | -- |
| Merchants | -62 | -70 | -10 | -66 | -60 | -- | -- |
| Service Industries | -66 | -62 | -21 | -65 | -62 | -- | -- |

Tom Moeller
AuthorMore in Author Profile »Prior to joining Haver Analytics in 2000, Mr. Moeller worked as the Economist at Chancellor Capital Management from 1985 to 1999. There, he developed comprehensive economic forecasts and interpreted economic data for equity and fixed income portfolio managers. Also at Chancellor, Mr. Moeller worked as an equity analyst and was responsible for researching and rating companies in the economically sensitive automobile and housing industries for investment in Chancellor’s equity portfolio. Prior to joining Chancellor, Mr. Moeller was an Economist at Citibank from 1979 to 1984. He also analyzed pricing behavior in the metals industry for the Council on Wage and Price Stability in Washington, D.C. In 1999, Mr. Moeller received the award for most accurate forecast from the Forecasters' Club of New York. From 1990 to 1992 he was President of the New York Association for Business Economists. Mr. Moeller earned an M.B.A. in Finance from Fordham University, where he graduated in 1987. He holds a Bachelor of Arts in Economics from George Washington University.
More Economy in Brief


