 Global| Jul 07 2009
Gasoline Prices Decline AsEconomic Momentum Fades Further
by:Tom Moeller
|in:Economy in Brief
Summary
The energy markets continued to reflect the recent and developing worry that forward momentum in the U.S. economy has faded. Yesterday, the cash market price for a gallon of regular gasoline fell to $1.71 versus the daily high of [...]
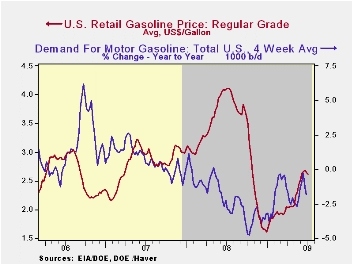
The energy markets continued to reflect the recent and developing worry that forward momentum in the U.S. economy has faded. Yesterday, the cash market price for a gallon of regular gasoline fell to $1.71 versus the daily high of $2.04 reached in the middle of June. For the full week, the average price fell to $1.84. Retail gas prices have followed these declines, but to a lesser extent. The pump price for regular gasoline fell last week to an average $2.61 per gallon, down eight cents from the high. Nevertheless prices remained up by one dollar from the December low and were at the highest level since late-October. The figures are reported by the U.S. Department of Energy and can be found in Haver's WEEKLY & DAILY databases.
Lower crude oil prices have led the
decline in refined product prices. Yesterday the one-month futures
price for light sweet crude oil dropped to $64.05 from an average
$69.36 last week. Prices had reached a daily high of $72.68.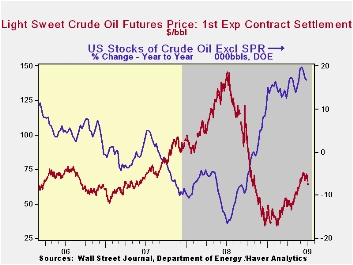
The weakness in energy prices is against the backdrop of soft demand. The ongoing recession reduced the demand for motor gasoline by 1.8% y/y during the last four weeks. There is good news, however. The rate of decline has moderated from the 4.8% shortfall this past autumn. Demand for distillate also is off sharply though residual fuel oil demand has moved higher. Finally, oil remains plentiful as evidenced by a 13.5% y/y rise in inventories of crude oil & petroleum products. Inventories of gasoline are flat y/y but crude oil inventories less the SPR are up by 16.8%. The figures on crude oil production and inventories are available in Haver's OILWKLY database.
Finally, natural gas prices did recover during the last two weeks, but the trend since April has definitely been sideways. Last week's average price of $3.69 per mmbtu (-72.1% y/y) was down from a recent high of $4.02. Current prices are down by two-thirds from the high reached in early-July of $13.19/mmbtu.
Time variation in the inflation passthrough of energy prices from the Federal Reserve Bank of Kansas City can be found here.
| Weekly Prices | 07/06/09 | 06 /29/09 | Y/Y | 2008 | 2007 | 2006 |
|---|---|---|---|---|---|---|
| Retail Regular Gasoline ($ per Gallon, Regular) | 2.61 | 2.64 | -36.5% | 3.25 | 2.80 | 2.57 |
| Light Sweet Crude Oil, WTI ($ per bbl.) | 69.36 | 68.76 | -51.3% | 100.16 | 72.25 | 66.12 |
by Tom Moeller July 7, 2009
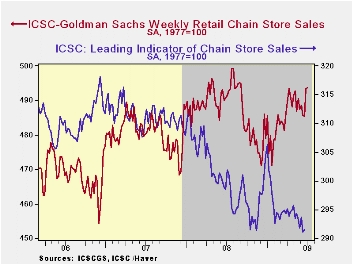
The Fourth of July seems to have prompted consumer spending this year. During the latest week, chain store sales ticked up all of 0.1%. That, however, was enough to pull the y/y change up to +0.5% after a y/y gain of 0.6% last week. Maybe the consumer is finding his footing? These are the first positive comparisons since late last year. But the consumer definitely isn't spending with wild abandonee. The latest gains fall well short of the three-to-seven percent growth rates logged during the last several years.
During the last ten years there has been a 69% correlation between the year-to-year growth in chain store sales and the growth in general merchandise sales. The weekly figures are available in Haver's SURVEYW database.
The ICSC-Goldman Sachs retail chain-store sales index is constructed using the same-store sales (stores open for one year) reported by 78 stores of seven retailers: Dayton Hudson, Federated, Kmart, May, J.C. Penney, Sears and Wal-Mart.
In tandem with the idea that the consumer isn't yet spending freely, the leading indicator of sales ticked up all of 0.1% during the latest week. That uptick left the indicator down 2.5% y/y and it has been flat-to-lower all this year.
Exit Strategies for the Federal Reserve from the Federal Reserve Bank of St. Louis can be found here.
| ICSC-UBS (SA, 1977=100) | 07/04/09 | 06/27/09 | Y/Y | 2008 | 2007 | 2006 |
|---|---|---|---|---|---|---|
| Total Weekly Chain Store Sales | 493.8 | 493.4 | 0.5% | 1.4% | 2.8% | 3.3% |
by Louise Curley July 7, 2009
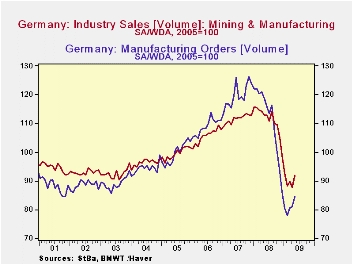 The volume
of new orders in German Manufacturing rose 4.4% in May after a small
rise of 0.1% in April and a 3.7% rise in March. The three
month rise has brought the level of new orders to 84.5
(2005=100). This is still 33% below the peak of 126.1
recorded in November, 2007. Sales of German Manufacturing and
Mining product rose 4.5% in May after a decline of 2.0% in April and a
1.6% rise in March. Sales are now at an index level of 91.8, 21% below
the peak of 115.7 reached in January, 2008. To put the recent
improvements in perspective, the volume of new orders and sales over
the 8 plus years are shown in the first chart.
The volume
of new orders in German Manufacturing rose 4.4% in May after a small
rise of 0.1% in April and a 3.7% rise in March. The three
month rise has brought the level of new orders to 84.5
(2005=100). This is still 33% below the peak of 126.1
recorded in November, 2007. Sales of German Manufacturing and
Mining product rose 4.5% in May after a decline of 2.0% in April and a
1.6% rise in March. Sales are now at an index level of 91.8, 21% below
the peak of 115.7 reached in January, 2008. To put the recent
improvements in perspective, the volume of new orders and sales over
the 8 plus years are shown in the first chart.
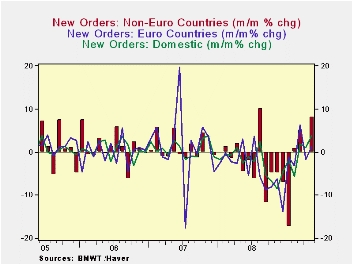
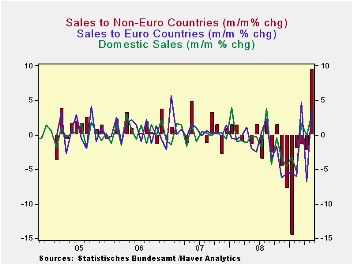 Much of
the
improvement in both orders and sales was due to a jump in foreign
sales. While domestic new orders rose 3.9% in May, new orders
from the Euro Area countries rose, 5.2% and from the non Euro Area
countries, 8.2%. The comparable figures for sales were 2.9%,
3.9% and 9.4%. The month to month percent changes
in domestic new orders, Euro Area countries new orders and Non Euro
Area countries new orders are shown in the second chart.
Much of
the
improvement in both orders and sales was due to a jump in foreign
sales. While domestic new orders rose 3.9% in May, new orders
from the Euro Area countries rose, 5.2% and from the non Euro Area
countries, 8.2%. The comparable figures for sales were 2.9%,
3.9% and 9.4%. The month to month percent changes
in domestic new orders, Euro Area countries new orders and Non Euro
Area countries new orders are shown in the second chart.
 Signs of
recovery in new orders and sales in the manufacturing sector are
particularly important for Germany as manufacturing plays such an
important role in the German economy. Manufacturing accounts
for about 25% of Germany's GDP in contrast to the United States where
manufacturing accounts for about 14% of the economy.
Signs of
recovery in new orders and sales in the manufacturing sector are
particularly important for Germany as manufacturing plays such an
important role in the German economy. Manufacturing accounts
for about 25% of Germany's GDP in contrast to the United States where
manufacturing accounts for about 14% of the economy.
| GERMAN MANUFACTURING ORDERS AND SALES (2005=100) | May 09 | Apr 09 | May 08 | M/M% Chg | Y/Y % Chg | 2008 | 2007 | 2006 |
|---|---|---|---|---|---|---|---|---|
| New Orders, | 84.5 | 80.9 | 118.6 | 4.45 | -28.75 | 111.3 | 119.7 | 108.9 |
| Domestic | 86.2 | 83.0 | 113.8 | 3.86 | -24.25 | 108.3 | 114.8 | 106.8 |
| Euro Area Countries | 83.1 | 79.0 | 122.8 | 5.19 | -32.33 | 113.9 | 124.0 | 110.8 |
| Non Euro Area Countries | 88.5 | 81.8 | 124.8 | 8.19 | -29.09 | 118.0 | 125.0 | 113.4 |
| Sales | 91.8 | 87.8 | 113.1 | 4.56 | -18.83 | 111.2 | 111.6 | 105.6 |
| Domestic | 92.2 | 89.6 | 107.7 | 2.90 | -14.39 | 106.7 | 106.4 | 102.8 |
| Euro Area Countries | 88.5 | 85.2 | 116.8 | 3.87 | -24.23 | 113.6 | 116.1 | 107.0 |
| Non Euro Area Countries | 93.8 | 85.7 | 122.8 | 9.45 | -23.62 | 121.1 | 119.9 | 110.9 |

Tom Moeller
AuthorMore in Author Profile »Prior to joining Haver Analytics in 2000, Mr. Moeller worked as the Economist at Chancellor Capital Management from 1985 to 1999. There, he developed comprehensive economic forecasts and interpreted economic data for equity and fixed income portfolio managers. Also at Chancellor, Mr. Moeller worked as an equity analyst and was responsible for researching and rating companies in the economically sensitive automobile and housing industries for investment in Chancellor’s equity portfolio. Prior to joining Chancellor, Mr. Moeller was an Economist at Citibank from 1979 to 1984. He also analyzed pricing behavior in the metals industry for the Council on Wage and Price Stability in Washington, D.C. In 1999, Mr. Moeller received the award for most accurate forecast from the Forecasters' Club of New York. From 1990 to 1992 he was President of the New York Association for Business Economists. Mr. Moeller earned an M.B.A. in Finance from Fordham University, where he graduated in 1987. He holds a Bachelor of Arts in Economics from George Washington University.
More Economy in Brief


