 Global| Oct 17 2005
FY 2005 U.S. Budget Deficit Fell Due To Higher Receipts
by:Tom Moeller
|in:Economy in Brief
Summary
The U.S. federal government ran a budget deficit of $318.6B during FY05, down nearly one quarter from the record deficit of $412.1B during the prior fiscal year.As a percentage of GDP, the deficit fell to 2.6% from 3.6% in FY04. Net [...]
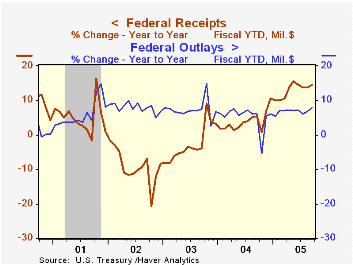
The U.S. federal government ran a budget deficit of $318.6B during FY05, down nearly one quarter from the record deficit of $412.1B during the prior fiscal year.As a percentage of GDP, the deficit fell to 2.6% from 3.6% in FY04.
Net receipt growth of 14.6% during FY05 was capped by a 62.5% m/m spike in September. That gain was led by a 31.6% m/m rise in individual income taxes (44% of total receipts) which followed an 18.3% August increase. For the fiscal year, the 14.6% rise in individual income taxes was the strongest since 1981.
Corporate income taxes (10% of total receipts) also reflected the improved economy and spiked higher in September. The 47.0% y/y gain during FY05 was the strongest since 1952 and followed a 43.7% jump the prior year. 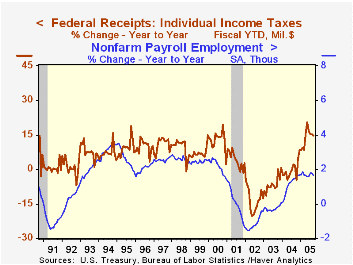
The improved job market raised employment taxes (36% of total receipts) 8.8% y/y during all of FY 2005, the strongest increase since 1988.
U.S. net outlays grew 7.9% during FY05. Federal outlays on defense (19% of total outlays) continued to surge but the 8.3% gain during FY05 actually was down from 12.8% growth during FY04 and from 15.9% during FY 03. Medicare spending (12% of total outlays) surged during the last two months and lifted FY05 growth to 10.9%, the strongest since 1992. Spending on social security (21% of total outlays) fell in September and the decline limited the increase during FY 05 to a still high 5.6%. Spending on health programs (10% of the total) rose 4.3% during FY05 while spending on education & training (4% of the total) surged 11.3%. interest expense (8% of the total) grew 14.9% with higher interest rates versus a modest rise last year and declines during the prior six fiscal years.
Do Budget Deficits Cause Inflation? from the Federal Reserve Bank of Philadelphia can be found here.
| US Government Finance | Sept | Aug | FY 2005 | FY2004 | FY2003 | FY2002 |
|---|---|---|---|---|---|---|
| Budget Balance | $35.8B | $-51.6B | $-318.6B | $-412.1B | $-377.6B | $-157.8B |
| Net Revenues | $252.6B | $155.4B | 14.6% | 5.5% | -3.8% | -6.9% |
| Net Outlays | $216.8B | $207.0B | 7.9% | 6.2% | 7.4% | 7.9% |
by Tom Moeller October 17, 2005
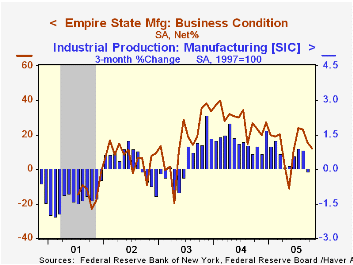
The Empire State Index of General Business Conditions in New York's manufacturing industries for October fell unexpectedly to 12.08 from a downwardly revised 15.58 in September. Consensus expectations had been for improvement to 19.0.
Since the series' inception in 2001 there has been a close 80% correlation between the index level and the three month change in factory sector production.
Lower shipments and employment indexes figured largely in the October report, although the new orders index recovered more than half of the prior month's sharp decline. Prices paid rose to near the record high levels of late last year. 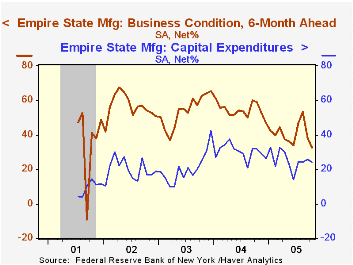
Like the Philadelphia Fed Index of General Business Conditions, the Empire State Business Conditions Index reflects answers to an independent survey question; it is not a weighted combination of the components.
The index of expectations for business conditions in six months fell to the lowest level since 2001 and expectations for future capital spending fell slightly.
The Empire State Manufacturing Survey is a monthly survey of manufacturers in New York State conducted by the Federal Reserve Bank of New York. Participants from across the state in a variety of industries respond to a questionnaire and report the change in a variety of indicators from the previous month. Respondents also state the likely direction of these same indicators six months ahead. April 2002 is the first report, although survey data date back to July 2001.
For more on the Empire State Manufacturing Survey, including methodologies and the latest report, click here.
| Empire State Manufacturing Survey | Oct | Sept | Oct '04 | 2004 | 2003 | 2002 |
|---|---|---|---|---|---|---|
| General Business Conditions (diffusion index) | 12.08 | 15.58 | 23.75 | 28.76 | 16.17 | 7.19 |
by Louise Curley October 17, 2005
Among industrial countries the rise in inflation as measured by the year over year increase in the consumer price index has, to date, been relatively well contained in spite of the rise in energy costs. Inflation at the wholesale and producer levels where the impact of higher energy costs are more directly felt has, however, begun to accelerate. If past relationships hold, the pace of consumer price inflation should begin to step up. 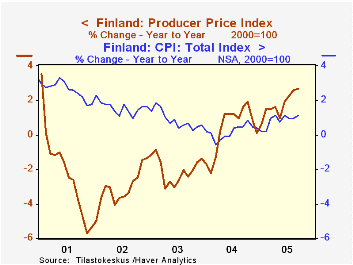
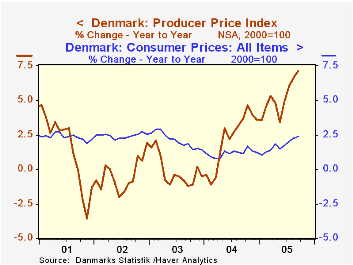
Denmark and Finland, two countries reporting wholesale and producer price indexes today are illustrative of these trends. Most countries no longer distinguish between wholesale and producer price indexes, publishing only the producer price index, but these countries still publish both indexes. The composition of the indexes are not strictly comparable. In September, the Danish index of fuel and oil in the wholesale index rose 47.32% over September, 2004 the wholesale index was up 5.32%, the producer price index, 7.12% and the consumer price index, 2.39%. The first chart shows the year over year increases in the producer price and the consumer price indexes for Denmark. 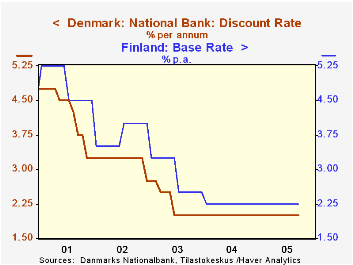
The September Finnish index of energy costs was 15.50% above the index of September, 2004. The wholesale price index was up 3.83%, the producer price index, 2.67% and the consumer price index, 1.14% The second chart shows the year over year increases in the producer price and consumer price indexes for Finland.
Inflation in Finland has been lower than that in Denmark since late 2001. One factor accounting for the difference could be different monetary policies in the two countries. As a member of the Euro Zone, Finland has been subject to a somewhat tighter monetary policy than that in Denmark, which is outside the Euro Zone. The third chart shows the official base rates in the two countries as an indicator of monetary policy. Since late 2001, the base rate in Finland has been above that in Denmark.
| Price Indexes (2000=100) | Sep 05 | Aug 05 | Sep 04 | M/M % | Y/Y % | 2004 % | 2003 % | 2002 % |
|---|---|---|---|---|---|---|---|---|
| Denmark | ||||||||
| Fuel and Oil Prices (PPI) | 165.8 | 157.9 | 116.5 | 5.04 | 42.33 | 107.8 | 92.9 | 89.3 |
| Producer Price Index | 111.3 | 110.5 | 103.9 | 0.72 | 7.12 | 103.0 | 100.8 | 101.0 |
| Wholesale Price Index | 110.9 | 110.3 | 105.3 | 0.54 | 5.32 | 104.5 | 102.3 | 102.1 |
| Consumer Price Index | 111.2 | 110.3 | 108.6 | 0.82 | 2.39 | 108.3 | 107.0 | 104.8 |
| Finland | ||||||||
| Energy Costs (WPI) | 136.4 | 134.6 | 118.1 | 1.34 | 15.50 | 113.9 | 107.5 | 101.1 |
| Producer Price Index | 96.1 | 65.6 | 63.6 | 0.52 | 2.67 | 93.1 | 92.8 | 94.7 |
| Wholesale Price Index | 102.9 | 102.7 | 99.1 | 0.19 | 3.83 | 98.3 | 97.4 | 97.7 |
| Consumer Price Index | 106.9 | 106.3 | 105.7 | .0.56 | 1.14 | 105.3 | 105.1 | 104.2 |

Tom Moeller
AuthorMore in Author Profile »Prior to joining Haver Analytics in 2000, Mr. Moeller worked as the Economist at Chancellor Capital Management from 1985 to 1999. There, he developed comprehensive economic forecasts and interpreted economic data for equity and fixed income portfolio managers. Also at Chancellor, Mr. Moeller worked as an equity analyst and was responsible for researching and rating companies in the economically sensitive automobile and housing industries for investment in Chancellor’s equity portfolio. Prior to joining Chancellor, Mr. Moeller was an Economist at Citibank from 1979 to 1984. He also analyzed pricing behavior in the metals industry for the Council on Wage and Price Stability in Washington, D.C. In 1999, Mr. Moeller received the award for most accurate forecast from the Forecasters' Club of New York. From 1990 to 1992 he was President of the New York Association for Business Economists. Mr. Moeller earned an M.B.A. in Finance from Fordham University, where he graduated in 1987. He holds a Bachelor of Arts in Economics from George Washington University.
More Economy in Brief


