 Global| Jul 24 2009
Full-Month Michigan ConsumerSentiment Reading Eases
by:Tom Moeller
|in:Economy in Brief
Summary
Worries about the prospects for the economy persisted late this month, but they eased somewhat from earlier. The University of Michigan's full-month reading of July consumer sentiment came in at 66.0 versus the mid-month reading of [...]
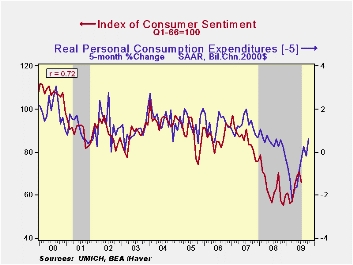 Worries
about the prospects for the economy persisted late this month, but they
eased somewhat from earlier. The University of Michigan's full-month
reading of July consumer sentiment came in at 66.0 versus the mid-month
reading of 64.6. Despite the improvement, however, sentiment was at its
lowest level since May. Consensus expectations had been for a slightly
lower July reading of 65.0. During the last ten years, there has been a
72% correlation between the level of sentiment and the growth in real
consumer spending during the next five months.
Worries
about the prospects for the economy persisted late this month, but they
eased somewhat from earlier. The University of Michigan's full-month
reading of July consumer sentiment came in at 66.0 versus the mid-month
reading of 64.6. Despite the improvement, however, sentiment was at its
lowest level since May. Consensus expectations had been for a slightly
lower July reading of 65.0. During the last ten years, there has been a
72% correlation between the level of sentiment and the growth in real
consumer spending during the next five months.
The expectations
component of the sentiment index deteriorated the most this month, but
less than the mid-month read. It posted an 8.7% m/m decline. 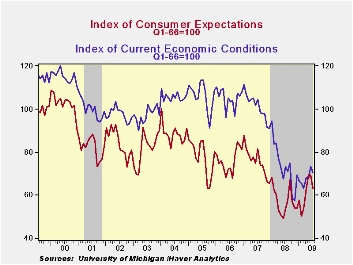 That
nevertheless left the index up sharply y/y. Expectations for personal
finances fell m/m to the lowest level since March (+4.8% y/y). Expected
business conditions during the next year held steady at the June level
(+64.3% y/y) but expectations for conditions during the next five years
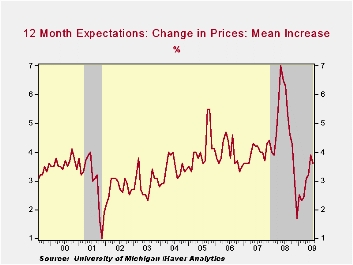
fell sharply (+12.3% y/y). Inflation expectations for the next year
slipped to 3.6% from 3.9% during June. That compares to a low of 1.7%
last December but remained down from a reading which was as high as
7.0% during May of last year. The highest expectations were for 5.3%
price inflation while the lowest were for 0.3%.
That
nevertheless left the index up sharply y/y. Expectations for personal
finances fell m/m to the lowest level since March (+4.8% y/y). Expected
business conditions during the next year held steady at the June level
(+64.3% y/y) but expectations for conditions during the next five years
fell sharply (+12.3% y/y). Inflation expectations for the next year
slipped to 3.6% from 3.9% during June. That compares to a low of 1.7%
last December but remained down from a reading which was as high as
7.0% during May of last year. The highest expectations were for 5.3%
price inflation while the lowest were for 0.3%.
The reading of current economic conditions gave back roughly half of its improvement during June. As at mid-month, the decline was led by a reversal of the June rise in the index of current buying conditions for large household goods. The reading of current personal finances rose for the second month with higher stock market prices and reduced levels of personal debt. It has returned to the April level.
The opinion of government policy, which may eventually influence economic expectations, fell for the second month to its lowest level since February. An increased 32% of respondents thought that a poor job was being done by government while a reduced 23% thought that a good job was being done.
 The
University of Michigan survey data is not seasonally adjusted.
The reading is based on telephone interviews with about 500
households at month-end; the mid-month results are based on about 300
interviews. The summary indexes are in Haver's USECON
database with details in the proprietary UMSCA database.
The
University of Michigan survey data is not seasonally adjusted.
The reading is based on telephone interviews with about 500
households at month-end; the mid-month results are based on about 300
interviews. The summary indexes are in Haver's USECON
database with details in the proprietary UMSCA database.
Regulatory restructuring is today's House testimony by Fed Chairman Ben S. Bernanke and it can be found here.
Macroeconomic Models for Monetary Policy: Conference Summary from the Federal Reserve Bank of San Francisco is available here.
| University of Michigan | July | Mid-July | June | May | July y/y | 2008 | 2007 | 2006 |
|---|---|---|---|---|---|---|---|---|
| Consumer Sentiment | 66.0 | 64.6 | 70.8 | 68.7 | 5.8% | 63.8 | 85.6 | 87.3 |
| Current Conditions | 70.5 | 70.4 | 73.2 | 67.7 | -3.6 | 73.7 | 101.2 | 105.1 |
| Expectations | 63.2 | 60.9 | 69.2 | 69.4 | 18.1 | 57.3 | 75.6 | 75.9 |
by Carol Stone July 24, 2009
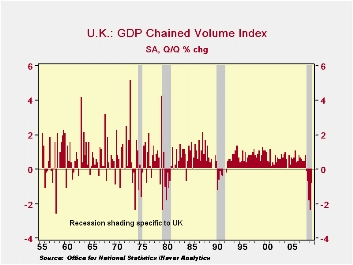
UK forecasters were looking for Q2 GDP to be down 0.3% from Q1, so they were surprised today at the -0.8% preliminary estimate published by ONS. Press reports emphasize the magnitude of the overall decline, 5.6% year-on-year, and 5.7% from the peak in Q1 2008. The year-on-year figure is the weakest of comparable GDP performances in the 54-year history of these quarterly series, and the peak-to-latest is perhaps tied with the 1979-81 recession as the largest total contraction in any recession.
Forecasters apparently put the most store in the manufacturing
sector, which is doing better. Output there is reported down just 0.3%
in the quarter, a marked improvement from the 5.5% during Q1. Within
the monthly data, March was actually higher by 0.2% and April held
steady with that before a renewed decline in May, 0.5%, also reported
this morning. But that most cyclical sector seems to be on the verge of
turning around.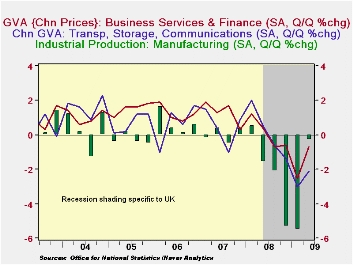
However, some service industries and construction remain feeble, even though they declined less that in prior recent periods. Construction had been down 5.0% and 6.9% in Q4 and Q1, respectively, so in one sense 2.2% in Q2 is "better". In an absolute sense, though, that's still quite weak. Similarly, services contracted 0.6%, somewhat less than 1.6% in Q1 and 1.0% in Q4. [All these growth rates are period-to-period, not annualized].
Within services, business services and finance apparently had the largest negative contribution, as they contracted 0.7%, with a weight of more than 30% in the total. The biggest single decline in a sector was 2.1% in transport, storage and communication, where activity fell 2.1% in Q2, but the industry group has only a 7% weight.
In such a severe recession as there's been, it might not be surprising that weakness has spilled more into services than we're used to. Further, the recession's origin in the over-extended financial sector suggests that it might well stay down longer than has been customary.
All this said, the 0.8% decrease in Q2 GDP is still much better than the prior two periods, and while the recession continues, the stabilization of manufacturing may well be a sign that recovery is developing.
| % Changes (not annualized), SA | 2005 Weight | Q2 2009 | Q1 2009 | Q4 2008 | 2008 | 2007 | |||
|---|---|---|---|---|---|---|---|---|---|
| Q/Q | Y/Y | Q/Q | Y/Y | Q/Q | Y/Y | ||||
| GDP | 1000 | -0.8 | -5.6 | -2.4 | -4.9 | -1.8 | -1.8 | 0.7 | 2.6 |
| Manufacturing | 133 | -0.3 | -12.6 | -5.5 | -13.8 | -5.2 | -8.2 | -2.8 | 0.6 |
| Construction | 63 | -2.2 | -14.7 | -6.9 | -13.2 | -5.0 | -5.3 | 0.2 | 2.7 |
| Services | 759 | -0.6 | -3.8 | -1.6 | -3.1 | -1.0 | -0.7 | 1.3 | 3.5 |
| Business & Finance | 304 | -0.7 | -4.4 | -2.5 | -3.4 | -0.6 | 0.3 | 2.4 | 5.5 |
| Transport, Storage & Communication | 72 | -2.1 | -7.0 | -3.0 | -4.5 | -1.4 | 0.5 | 2.0 | 3.5 |

Tom Moeller
AuthorMore in Author Profile »Prior to joining Haver Analytics in 2000, Mr. Moeller worked as the Economist at Chancellor Capital Management from 1985 to 1999. There, he developed comprehensive economic forecasts and interpreted economic data for equity and fixed income portfolio managers. Also at Chancellor, Mr. Moeller worked as an equity analyst and was responsible for researching and rating companies in the economically sensitive automobile and housing industries for investment in Chancellor’s equity portfolio. Prior to joining Chancellor, Mr. Moeller was an Economist at Citibank from 1979 to 1984. He also analyzed pricing behavior in the metals industry for the Council on Wage and Price Stability in Washington, D.C. In 1999, Mr. Moeller received the award for most accurate forecast from the Forecasters' Club of New York. From 1990 to 1992 he was President of the New York Association for Business Economists. Mr. Moeller earned an M.B.A. in Finance from Fordham University, where he graduated in 1987. He holds a Bachelor of Arts in Economics from George Washington University.
More Economy in Brief


