 Global| Nov 21 2019
French Business Climate Is Fractionally Improved
Summary
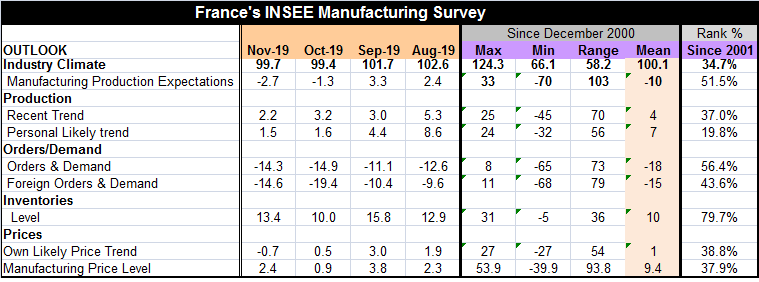
The French business climate indicator for industry ticked higher to 99.7 in November from 99.4 in October, a marginal improvement. Since 2001, the indicator ranks just above the lower one third of its queue of observations at its 34.7 [...]
 The French business climate indicator for industry ticked higher to 99.7 in November from 99.4 in October, a marginal improvement. Since 2001, the indicator ranks just above the lower one third of its queue of observations at its 34.7 percentile. The level of the confidence indicates that industrial momentum leaves something to be desired. The rise this month is a technical reversal of a declining trend as the index has fallen in each of the two previous months. The index, however, remains in a trend slippage mode this month; a one-month bounce hardly puts the indicator on an expanding path.
The climate index peaked in this cycle in January 2018 at 113.5. Five months later, it was below 110. Four months after that, it was below 105. By June 2019, the index value was fluctuating around the 101 to 102 mark. In October 2019, it fell below 100 for the first time since March 2015. Despite the rise this month, this is the first time a sub 100 reading has been posted for two months running since 2015.
Manufacturing production expectations are weaker month-to-month and are net negative for two months running. The November reading has a 51.5 percentile standing in its historic queue of data. The recent trend of production has a 37th percentile standing while firms assess their own firm’s prospects (or personal trends) as weaker with a very weak 19.8 percentile standing.
Orders and demand have weaker net readings than production but stronger queue standings and also show slippage month-to-month. Orders have a 56.4 percentile standing, compared to foreign orders with a 43.6 percentile standing. Total order standings are slightly above their median while foreign orders have a below median 43rd percentile standing.
As we see with other surveys, the production and orders data have clearly lower standings than the inventory data which is not a good thing when production and orders are slowing down. The suggestion is that inventories are getting a bit top heavy and that an inventory cycle may be in progress or about to be started or at least is at risk if there is not a pick-up in sales soon.
Prices reinforce the notion of weakness as firms see pricing for their products as subpar as well as seeing sub-trend price trends overall. The ranking for own prices and sector prices are quite similar with rank standings around the 38th percentile mark, well below their respective medians (medians always occur at a ranking of 50).
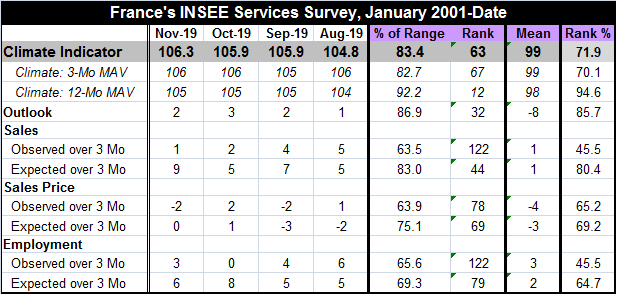
 The services survey shows better strength but is clearly fading. The top of the chart offers the climate gauge which does improve by four ticks month-to-month about the same degree of improvement as for industry. The next two lines are smoothed climate readings averaged over three months and 12 months. The three month climate gauge has a 70.1 percentile standing, nearly the same as for the one month indicator, while the 12-month smoothed gauge has a 94.6 percentile standing. Clearly compared to where the gauge has hovered over 12 months, current conditions have slipped; the slippage is made of more than 20 percentile points of rank lost. However, the one-month ranking is above the three-month ranking so maybe the slide in services is leveling out.
Service sector trends show weakening and very modest percentage gains alongside some revival in the level of the index. After an ongoing weakening throughout most of 2018, the level has undergone for revival and still the percentage gains are getting smaller. This dichotomy of a rising index level and fading percentage gains is reflected in the responses to the series survey.
The outlook for services is quite good with a rank standing in its 85.7 percentile. This standing is between the rank standing for climate and the rank standing for the 12-month average for climate.
We see this again in sales as observed sales decay month-to-month and have decayed since at least August. Expected sales have been unaffected by the slippage in actual sales and, in November, expected sales mysteriously jump. This leaves November’s observed sales with a 45.5 percentile standing below their median and expected sales with an 80.4 percentile standing, quite strong! Given global events and the tapped out nature of ECB policy, it is hard to see where this sort of optimism comes from, but there it is. We can watch to see if it has legs.
Prices do not display much optimism. Observed over three months, price trends have a 65.2 percentile standing and the expectations for three months ahead have a modestly higher 69.2 percentile standing. Prices have been and are expected to remain modestly above their respective medians.
Observed vs. expected employment gauges in services are interesting since services employment is a lagging statistic. What we see here is erosion in observed employment over four months, a period when expected employment trends remained firm and even strengthened a bit. The observed employment metric is below its median with a 45.5 percentile standing and compares to an expected trend with a 64.7 percentile standing. Neither reading is extreme, but the expected reading is nearly 20 ranking points higher- that is about one fifth of its range. Why the optimism?
 What we see in the services sector is an admission of weakening conditions with an overlay of optimism about the future splashed on top. This contrasts with what the industry survey says as it admits it has a situation of ongoing economic slippage. In services, we can see that even the 12-month average for climate has a very strong reading so maybe the slippage is being dismissed or brushed off since conditions have been so good for so long. Other surveys support this notion that manufacturing has been weak and services had been resilient… but now that services are now slipping there is a slight divergence as the INSEE survey sees services continuing this improvement while the EU commission indexes do not. The Markit sectors also see services moving sideways after some revival.
It may be that expectations for this series will be ‘the last thing to go’ as optimism springs eternal or at least until the internal contradiction becomes evident. The sector indexes from the EU Commission, up-to-date through October, show the same patterns, a peak for services and a slippage though 2018, a small revival at end-2018 into 2019 and now more slippage. The industrial readings for France show slippage to some stability. And among EMU countries, France already shows the most stability. Germany shows more downward momentum. All of this begs the question of where French optimism comes from. It remains unexplained. Can France stand alone as Europe decays?

Robert Brusca
AuthorMore in Author Profile »Robert A. Brusca is Chief Economist of Fact and Opinion Economics, a consulting firm he founded in Manhattan. He has been an economist on Wall Street for over 25 years. He has visited central banking and large institutional clients in over 30 countries in his career as an economist. Mr. Brusca was a Divisional Research Chief at the Federal Reserve Bank of NY (Chief of the International Financial markets Division), a Fed Watcher at Irving Trust and Chief Economist at Nikko Securities International. He is widely quoted and appears in various media. Mr. Brusca holds an MA and Ph.D. in economics from Michigan State University and a BA in Economics from the University of Michigan. His research pursues his strong interests in non aligned policy economics as well as international economics. FAO Economics’ research targets investors to assist them in making better investment decisions in stocks, bonds and in a variety of international assets. The company does not manage money and has no conflicts in giving economic advice.
More Economy in Brief


