 Global| Dec 12 2006
FOMC: Funds Rate Steady, Economy OK, Inflation Risks Remain
by:Tom Moeller
|in:Economy in Brief
Summary
At today's Federal Open Market Committee meeting the target interest rate for Federal funds was held steady at 5.25%. The rate was increased to the current level at the FOMC meeting in late June. Voting against the decision for the [...]
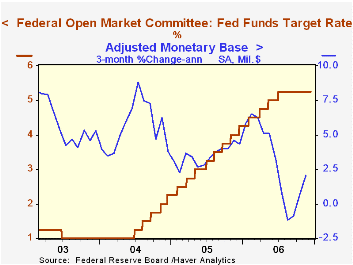
At today's Federal Open Market Committee meeting the target interest rate for Federal funds was held steady at 5.25%. The rate was increased to the current level at the FOMC meeting in late June.
Voting against the decision for the fourth consecutive meeting was Richmond Federal Reserve Bank President Jeffrey M. Lacker, who preferred an increase of 25 basis points in the federal funds rate target.
The discount rate also was held steady at 6.25%.
Today's decision was widely expected by analysts.
For the economy today's press release indicated that "Economic growth has slowed ...." but that "the economy seems likely to expand at a moderate pace on balance over coming quarters."
Regarding inflation the Fed indicated that "... core inflation (readings) have been elevated, and the high level of resource utilization has the potential to sustain inflation pressures. However, inflation pressures seem likely to moderate over time ..."
For the complete text of the Fed's latest press release please follow this link.
Trend Inflation and Inflation Persistence in the New Keynesian Phillips Curve from the Federal Reserve Bank of New York can be found here.
U.S. Trade Deficit Lowest in Over One Yearby Tom Moeller December 12, 2006
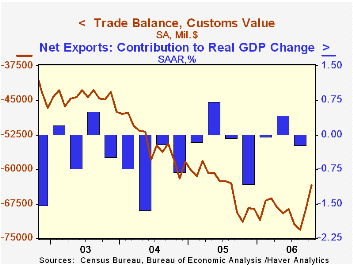
The U.S. foreign trade deficit in October dropped to the lowest level since July of 2005. The $58.9B shortfall compared to an unrevised $64.3B during September and was shallower than Consensus expectations for a deficit of $63.0B.
A seven dollar m/m drop in the cost of a barrel of crude oil to $55.47 from $62.52 in September helped imports of petroleum products to fall 13.5% (-12.7% y/y). The quantity of all energy related petroleum products also fell 3.3% (-7.5% y/y). In November crude oil prices recouped about half of the October decline.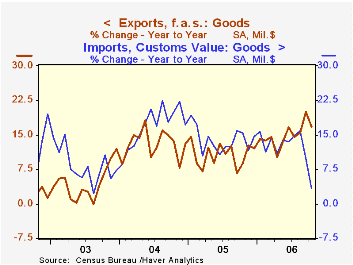
The falloff in petroleum lowered overall imports of goods & services in October by 2.7% m/m. In addition, imports of nonpetroleum products fell for the second month. The 0.7% (+6.7% y/y) drop reflected a second decline in capital goods imports (10.0% y/y) and a 1.6% (-0.1% y/y) falloff in automotive vehicles & parts. Working in the other direction, nonauto consumer goods imports rose 0.6% (10.9% y/y) while imports of advanced technology products surged (14.6% y/y).
Total exports rose just 0.2%, the smallest gain in three months, held back by a 0.7% (+2.5% y/y) decline in automotive and a slim 0.1% (14.3% y/y) rise in capital goods exports. Exports of complete civilian aircraft slipped (+38.9% y/y) but aircraft parts & engines were firm. Computer exports surged 15.4% (14.4% y/y) but exports of telecommunications equipment slipped 2.7% (+15.9% y/y). Exports of nonauto consumer goods recovered September's drop and jumped 3.6% (17.3% y/y).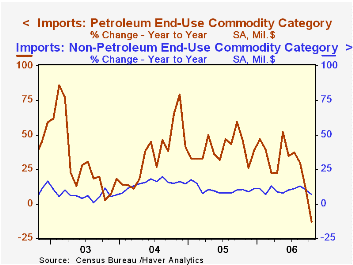
Service exports jumped 1.2% (7.8% y/y) as travel exports recovered the September decline with a 1.2% (5.2% y/y) increase and passenger fares firmed 1.3% (-1.0% y/y). Imports of services rose 0.8% (8.6% y/y) reflecting strength in travel (7.2% y/y) and passenger fares (3.7% y/y).
The U.S. trade deficit in goods with China deepened to another record of $24.4B in October ($201.5B in 2005) though exports surged 6.6% (25.2% y/y) but imports rose 6.2% (20.2% y/y). The balance of goods trade with the newly industrialized Asian countries nearly tripled m/m to a deficit of $1.6B (-$15.8B in 2005) as exports fell 4.9% (+8.1% y/y) and imports rose 5.2% (7.4% y/y).
The lower value of the dollar helped US exports to Europe jump another 3.0% (20.8% y/y). Imports just recovered a September decline with a 10.2% (2.9% y/y) rise. Exports to Germany surged 6.8% (35.8% y/y) and the 9.3% gain in imports (-2.2% y/y) didn't recover a 12.9% September decline.
Truths About Trade and the Dollar from the Federal Reserve Bank of Minneapolis is available here.
| Foreign Trade | October | September | Y/Y | 2005 | 2004 | 2003 |
|---|---|---|---|---|---|---|
| U.S. Trade Deficit | $58.9B | $64.3B | $66.6B (10/05) |
$716.7B | $611.3B | $494.9B |
| Exports - Goods & Services | 0.2% | 0.5% | 13.8% | 10.7% | 13.4% | 4.2% |
| Imports - Goods & Services | -2.7% | -1.9% | 4.2% | 13.0% | 16.7% | 8.3% |
by Tom Moeller December 12, 2006
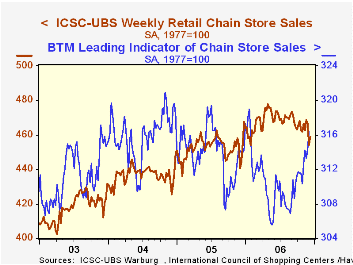
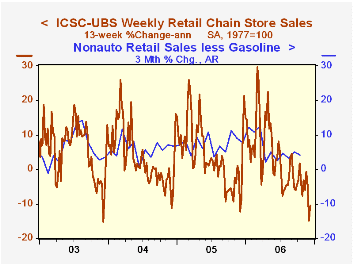
The ICSC-UBS retail chain-store sales index is constructed using the same-store sales (stores open for one year) reported by 78 stores of seven retailers: Dayton Hudson, Federated, Kmart, May, J.C. Penney, Sears and Wal-Mart.
The leading indicator of chain store sales from ICSC-UBS advanced for the fourth week in the last five. The 0.7% increase (0.7% y/y) pulled the measure up 3.5% from the May low.
Survey Says Families are Digging Deeper Into Debt from the Federal Reserve Bank of St. Louis can be found here.
| ICSC-UBS (SA, 1977=100) | 12/09/06 | 12/02/06 | Y/Y | 2005 | 2004 | 2003 |
|---|---|---|---|---|---|---|
| Total Weekly Chain Store Sales | 458.8 | 454.4 | 3.2% | 3.6% | 4.7% | 2.9% |
by Tom Moeller December 12, 2006
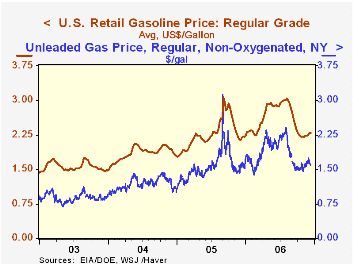
The latest Short-Term Energy Outlook from the U.S. Energy Information Administration is available here.
| Weekly Energy Prices | 12/11/06 | 12/04/06 | Y/Y | 2005 | 2004 | 2003 |
|---|---|---|---|---|---|---|
| US Retail Gasoline Price, Regular | $2.29 | $2.30 | 4.9% | $2.27 | $1.85 | $1.56 |
by Tom Moeller December 12, 2006
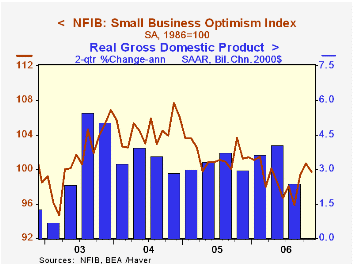
The November index of small business optimism gave back most of its October rise and fell 1.0% to 99.7, according to the National Federation of Independent Business (NFIB). Nevertheless the figure remained well up from its June low of 96.7.
During the last ten years there has been a 70% correlation between the level of the NFIB index and the two quarter change in real GDP.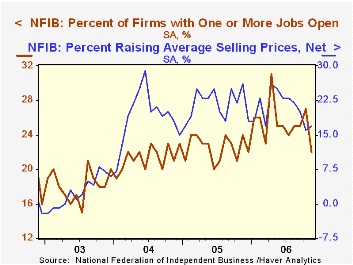
Respondents expecting the economy to improve held at a recent high but the percentage of firms with job openings fell sharply.
During the last ten years there has been a 72% correlation between the NFIB percentage and the y/y change in nonfarm payrolls.
The percent planning to raise capital expenditures remained at a firm 31%, about the same as during the last two years..The percentage of firms planning to raise average selling prices ticked back up to a still low 22%. The percentage of firms actually raising prices also rose to a low 17%. During the last ten years there has been a 60% correlation between the change in the producer price index and the level of the NFIB price index.
About 24 million businesses exist in the United States. Small business creates 80% of all new jobs in America.
| Nat'l Federation of Independent Business | November | October | Y/Y | 2005 | 2004 | 2003 |
|---|---|---|---|---|---|---|
| Small Business Optimism Index (1986=100) | 99.7 | 100.7 | -1.5% | 101.6 | 104.6 | 101.3 |
by Tom Moeller December 12, 2006
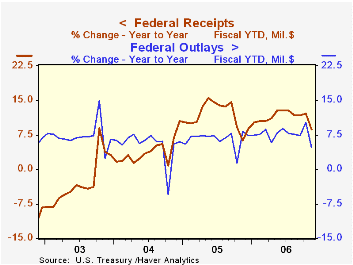
The U.S. federal government's budget deficit in November fell to $75.6B versus a deficit of $83.1B last November. That pulled the figure for the first two months of FY07 to $124.9B against $130.3B during last fiscal year's first two months. The Congressional Budget Office expects the FY 2007 deficit to total $286B, up slightly from last year's deficit of $247.7B.
As a percentage of GDP, the U.S. budget deficit fell last year to 1.9% from 2.6% in FY2005.
Net revenues grew 8.8% y/y during the first two months of FY07. Individual income tax receipts (44% of total receipts) grew 11.8% as withheld taxes rose 9.7% due to employment growth and non-withheld taxes (primarily on capital gains) surged 45.8%. Corporate income taxes (13% of total receipts) surged 21.5% as corporate profits grew. Estate & gift taxes fell 1.1% while higher employment levels raised social insurance & retirement receipts by 4.2%.
U.S. net outlays grew 4.7% during this fiscal year's first two months versus last year. Defense spending (19% of total outlays) grew 13.6% and Medicare expenditures (12% of outlays) surged 42.5%. Social security spending (21% of outlays) rose 6.0% but the recent bond market rally dropped the government's interest expense by 11.0% y/y.
Middle-Income Tax Rates: Trends and Prospects from the Federal Reserve Bank of Kansas City can be found here.
| US Government Finance | November | October | Y/Y | FY 2006 | FY 2005 | FY 2004 |
|---|---|---|---|---|---|---|
| Budget Balance | -$75.6B | -$49.3B | -$83.1B (11/05) |
-$247.7 | -$318.7B | -$412.7B |
| Net Revenues | $145.9B | $167.7B | 5.1% | 11.8% | 14.5% | 5.5% |
| Net Outlays | $221.5B | $217.0B | -0.2% | 7.4% | 7.8% | 6.2% |
by Louise Curley December 12, 2006
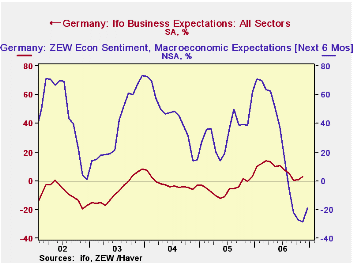
The ZEW institute which polls institutional investors and analysts regarding their opinions on the current state of the German economy and the outlook six months ahead announced today that in December the balance of pessimists over optimists declined from 28.5% to 19.0%. Investors and analysts have been more pessimistic than the managers of firms in manufacturing, construction and wholesale and retail trade polled in the broader IFO survey. The latter began to show a more positive outlook in October and increased their optimism in November when optimists exceeded pessimists by 2.7%. The first chart shows the percent balances of opinions of investors and analysts in the ZEW survey and of the managers in the IFO survey regarding the six months outlook.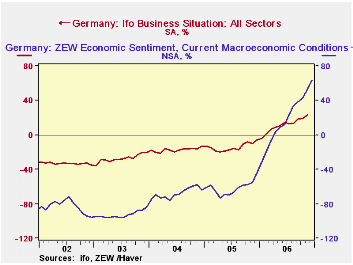
Both investors and managers have shown increasing confidence in their current situations. However, it is among the investors and analysts that more optimists than pessimists prevail regarding the current situation. In November, the excess of optimists among managers was 23.4% and among investors and analysts, 53.0%. The excess of optimists among the latter increased to 63% in December. The second chart shows the percent balances of the investors and analysts in the ZEW survey and the managers in the IFO survey regarding current conditions.
The improvement in confidence shown by both the IFO and ZEW polls is another sign that, although some slowdown is expected in the first quarter of 2007, there is a growing consensus that the current German expansion is strong enough to weather the impact of a strong euro and a tighter fiscal policy. Several of the six institutes that regularly monitor the German economy, have increased their forecasts for 2007. The Kiel based IfW institute, for example, announce today that it has doubled its estimate of German growth in 2007 from 1.0% to 2.1%.
| ZEW INDICATOR (% balance) | Dec 06 | Nov 06 | Dec 05 | M/M dif | Y/Y dif | 2006 | 2005 | 2004 |
|---|---|---|---|---|---|---|---|---|
| Current Conditions | 63.5 | 53.0 | -44.4 | 10.5 | 107.9 | 18.3 | -61.8 | -67.7 |
| Conditions 6 Months Ahead | -19.0 | -28.5 | 61.6 | 9.5 | -80.6 | 22.3 | 34.8 | 44.6 |
| Nov 06 | Oct 06 | Nov 05 | M/M dif | Y/Y dif | 2006 | 2005 | 2004 | |
| IFO INDICATOR (% balance) | -- | -- | -- | -- | -- | -- | -- | -- |
| Current Conditions | 23.4 | 19.4 | -9.7 | 4.0 | 33.1 | n.a | -14.2 | -17.4 |
| Conditions 6 Months Ahead | 2.7 | 0.7 | -0.8 | 2.0 | 3.5 | n.a | -5.0 | -2.0 |

Tom Moeller
AuthorMore in Author Profile »Prior to joining Haver Analytics in 2000, Mr. Moeller worked as the Economist at Chancellor Capital Management from 1985 to 1999. There, he developed comprehensive economic forecasts and interpreted economic data for equity and fixed income portfolio managers. Also at Chancellor, Mr. Moeller worked as an equity analyst and was responsible for researching and rating companies in the economically sensitive automobile and housing industries for investment in Chancellor’s equity portfolio. Prior to joining Chancellor, Mr. Moeller was an Economist at Citibank from 1979 to 1984. He also analyzed pricing behavior in the metals industry for the Council on Wage and Price Stability in Washington, D.C. In 1999, Mr. Moeller received the award for most accurate forecast from the Forecasters' Club of New York. From 1990 to 1992 he was President of the New York Association for Business Economists. Mr. Moeller earned an M.B.A. in Finance from Fordham University, where he graduated in 1987. He holds a Bachelor of Arts in Economics from George Washington University.
More Economy in Brief


