 Global| Jun 29 2006
Fed Funds Rate Increased to 5.25%
by:Tom Moeller
|in:Economy in Brief
Summary
The Federal Open Market Committee raised the target interest rate for Federal funds 25 basis points to 5.25% at today's meeting. This seventeenth 25 basis point increase since June of 2004 was the result of a unanimous decision. The [...]
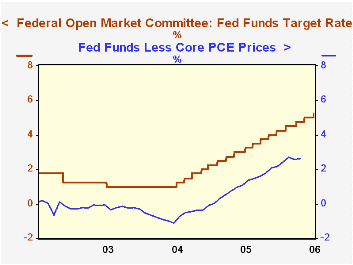
The Federal Open Market Committee raised the target interest rate for Federal funds 25 basis points to 5.25% at today's meeting. This seventeenth 25 basis point increase since June of 2004 was the result of a unanimous decision.
The discount rate also was raised 25 basis points to 6.25%.
The action was widely expected by analysts though market disappointment that rates weren't increased 50 basis points may be evident in yesterday's rise in gold prices.
The Fed's rationale for a 25 basis point increase was that "Recent indicators suggest that economic growth is moderating from its quite strong pace earlier this year ..." and that "inflation expectations remain contained."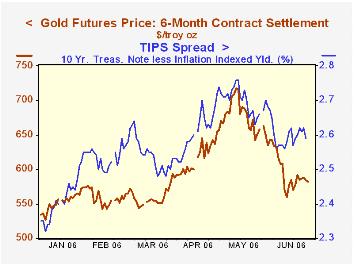
Ever vigilant for building inflationary pressure, the Fed statement succinctly stated that "the Committee judges that some inflation risks remain."
For the complete text of the Fed's latest press release please follow this link.
Market anticipation of recent Fed action is reflected in the decline, since early May, in gold futures prices and the so called "TIPS spread."
Reading the Minds of Investors: An Empirical Term Structure Model for Policy Analysis from the Federal Reserve Board is available here.
Reflections on the Yield Curve and Monetary Policy is Chairman Ben S. Bernanke's March speech and it can be found here.
US GDP & Profits Revised Up for 1Q. Price Gain Easierby Tom Moeller June 29, 2006
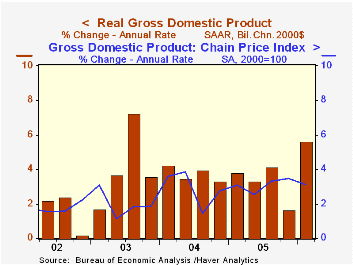
Growth in corporate profits was revised up sharply to 11.9% (28.5% y/y) from the initial estimate of a 7.9% gain during 1Q. Growth in the earnings of nonfinancial corporations was doubled to 9.4% (35.2% y/y) as profit margins surged to another record high. Overseas profits' growth also was revised up sharply to 14.4% (23.4% y/y) while strong 16.5% (18.4% y/y) growth in financial corporate profits was little changed.
Much of the upward revision to GDP growth owed to a lessening of the subtraction from a wider foreign trade deficit to -0.2% from -0.6%. Import growth was dropped to 10.7% (6.1% y/y) and the strength in exports was unchanged at 14.7% (8.1% y/y). 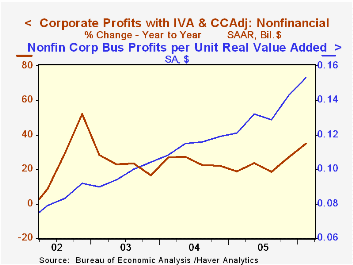
Inventories subtracted 0.2 percentage points from 1Q GDP growth, about the same as the -0.1 estimated last month but still less than the initial estimate of a 0.5% subtraction.
The estimate of the GDP chain price index was revised down slightly to 3.1%. Less final sales of computers, the chain price index grew 3.3% (3.3% y/y).
Real GDP per capita grew 4.8% (2.7% y/y) last quarter though per capita disposable income grew just 0.7% (0.4% y/y).
Intangible capital and economic growth from the Board of Governors of the Federal Reserve System is available here.
| Chained 2000$, % AR | 1Q '06 (Final) | 1Q '06 (Prelim.) | 4Q '05 | Y/Y | 2005 | 2004 | 2003 |
|---|---|---|---|---|---|---|---|
| GDP | 5.6% | 5.3% | 1.7% | 3.7% | 3.5% | 4.2% | 2.7% |
| Inventory Effect | -0.2% | -0.1% | 1.9% | -0.2% | -0.3% | 0.3% | 0.0% |
| Final Sales | 5.9% | 5.5% | -0.2% | 3.9% | 3.8% | 3.9% | 2.7% |
| Foreign Trade Effect | -0.2% | -0.6% | -1.4% | 0.0% | -0.1% | -0.5% | -0.3% |
| Domestic Final Demand | 5.8% | 5.7% | 1.1% | 3.9% | 3.9% | 4.4% | 3.0% |
| Chained GDP Price Index | 3.1% | 3.3% | 3.5% | 3.1% | 2.8% | 2.6% | 2.0% |
by Tom Moeller June 29, 2006
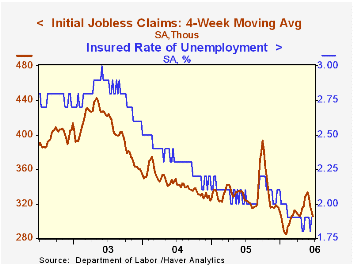
Initial unemployment insurance claims ticked up another 4,000 to 313,000 last week. The gain followed a 12,000 increase the prior week which was little changed. Consensus expectations had been for 305,000 claims.
The four-week moving average of initial claims fell to 305,500 (-6.3% y/y), the lowest level since late February.
Continuing claims for unemployment insurance rose 54,000 following a 66,000 decline the previous week which was revised from an 18,000 increase reported initially.
The insured rate of unemployment rose to 1.9% from a downwardly revised 1.8% the previous week.
The Yield Curve and Predicting Recessions from the Federal Reserve Board can be found here.
| Unemployment Insurance (000s) | 06/24/06 | 06/17/06 | Y/Y | 2005 | 2004 | 2003 |
|---|---|---|---|---|---|---|
| Initial Claims | 313 | 309 | -0.6% | 332 | 343 | 403 |
| Continuing Claims | -- | 2,409 | -7.5% | 2,663 | 2,923 | 3,530 |
by Tom Moeller June 29, 2006
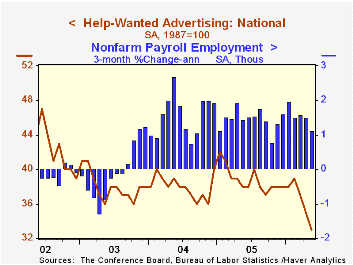
The Index of Help-Wanted Advertising from the Conference Board fell to 33 in May from 35 the prior month and an average of 39 last year. The decline dropped the figure to its lowest level since July 1961.
During the last ten years there has been a 60% correlation between the level of help-wanted advertising and the three month change in non-farm payrolls.
The proportion of labor markets with rising want-ad volume dropped to 27% versus an average 48% last year.
The Conference Board surveys help-wanted advertising volume in 51 major newspapers across the country every month.
The latest help wanted report from the Conference Board is available here.
Help-wanted advertising and job vacancies from the Federal Reserve Bank of San Francisco can be found here.
| Conference Board | May | April | May '05 |
|---|---|---|---|
| National Help Wanted Index | 33 | 35 | 38 |
by Carol Stone June 29, 2006
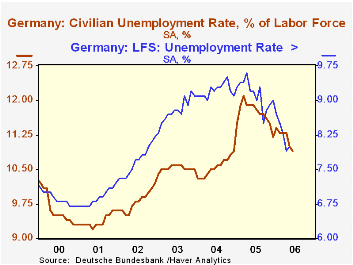
We last wrote about German labor markets three months ago. Since then there have been marginal changes. Employment shows signs of slight growth, according to seasonally adjusted labor force data. Unemployment by the ILO definition is basically steady at a level more than a full percentage point below year-ago amounts, although the more popular measure in Germany, "registered" unemployment, has shown less improvement. At the same time, job vacancies have been rising markedly, indicating some hope for later employment gains.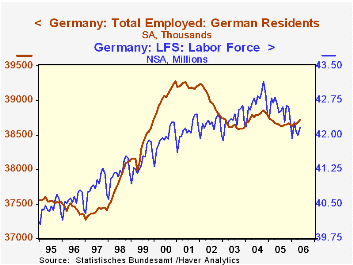
Total employment as measured in the labor force survey was 38.72 million in May, up 43,000 from April and 0.2% from May 2005. While this is a small increase, it still represents growth, a contrast to last year's experience when total employment contracted slightly from 2004.
Accompanying unemployment has decreased, although as we have explained before, in the face of stagnant employment, the lower unemployment is a result of people withdrawing from the labor force. This is seen in the second graph. A more realistic picture of labor conditions in Germany is perhaps given by the preferred local measure of joblessness, "registered unemployment". This rate is down from a year ago, but has moved in fits and starts and remains above its average for 2004.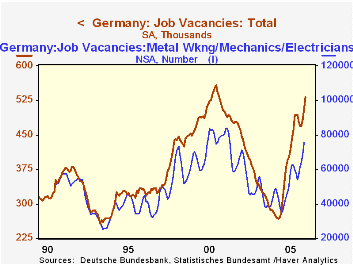
An optimistic note among the labor market data released today is the number of job vacancies. These are climbing, and at 531,000 for June, they are approaching their all-time high of 557,000 set in December 2000. Further, the gains are widespread among occupational groups in the German economy. Over the last year, total vacancies have increased 128,000; of these, 28,000 are in metal-working and machining jobs, 12,000 in administrative service functions, and 11,000 in construction. Nearly every category showed some year-on-year increase. So labor demand is looking better. We hope that soon translates into more workers.
| Germany: SA, ex as noted | June 2006 | May 2006 | Apr 2006 | Year Ago | 2005 | 2004 | 2003 |
|---|---|---|---|---|---|---|---|
| LFS Employment (mil) | -- | 38.72 | 38.68 | 38.66 | 38.67 | 38.78 | 38.63 |
| Change (thous) | -- | +43 | +18 | +5 | -12 | 16 | -11 |
| Yr/Yr % Chg NSA | -- | +0.2 | -0.4 | +0.5 | -0.3 | ||
| Unemployment Rate (%, ILO Def.) |
-- | 8.0 | 7.9 | 9.2 | 9.2 | 9.2 | 8.8 |
| Registered Unemployment Rate (%) | 10.9 | 11.0 | 11.3 | 11.9 | 11.6 | 10.6 | 10.5 |
| Job Vacancies (thous) | 531 | 506 | 485 | 403 | 394 | 225 | 258 |

Tom Moeller
AuthorMore in Author Profile »Prior to joining Haver Analytics in 2000, Mr. Moeller worked as the Economist at Chancellor Capital Management from 1985 to 1999. There, he developed comprehensive economic forecasts and interpreted economic data for equity and fixed income portfolio managers. Also at Chancellor, Mr. Moeller worked as an equity analyst and was responsible for researching and rating companies in the economically sensitive automobile and housing industries for investment in Chancellor’s equity portfolio. Prior to joining Chancellor, Mr. Moeller was an Economist at Citibank from 1979 to 1984. He also analyzed pricing behavior in the metals industry for the Council on Wage and Price Stability in Washington, D.C. In 1999, Mr. Moeller received the award for most accurate forecast from the Forecasters' Club of New York. From 1990 to 1992 he was President of the New York Association for Business Economists. Mr. Moeller earned an M.B.A. in Finance from Fordham University, where he graduated in 1987. He holds a Bachelor of Arts in Economics from George Washington University.
More Economy in Brief


