 Global| May 10 2006
Fed Funds Rate Increased to 5.00%
by:Tom Moeller
|in:Economy in Brief
Summary
The Federal Open Market Committee raised the target interest rate for Federal funds 25 basis points to 5.00% at today's meeting. This sixteenth 25 basis point increase since June of 2004 was the result of a unanimous decision and was [...]
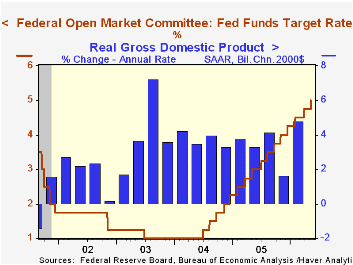
The Federal Open Market Committee raised the target interest rate for Federal funds 25 basis points to 5.00% at today's meeting. This sixteenth 25 basis point increase since June of 2004 was the result of a unanimous decision and was widely expected by analysts.
The discount rate also was raised 25 basis points to 6.00%.
The Fed's rationale for raising the rate was succinct. "Economic growth has been quite strong so far this year."
Future rate increases were perhaps suggested by the statement "... further policy firming may yet be needed to address inflation risks but emphasizes that the extent and timing of any such firming will depend importantly on the evolution of the economic outlook as implied by incoming information."
For the complete text of the Fed's latest press release please follow this link.
Is Price Stability Enough? by William R. White at the Bank for International Settlements can be found here.
Transparency, Expectations and Forecasts from the Federal Reserve Bank of Atlanta is available here.
Enhancing Fed Credibility from the Federal Reserve Bank of San Francisco is found here.
U.S. Budget Surplus Doubled in Aprilby Tom Moeller May 10, 2006
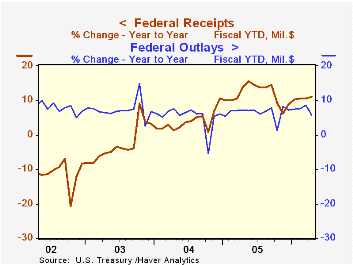
The U.S. federal government ran a budget surplus in April of $118.9B that was more than double the surplus during the same month last year. The surplus improved the FY06 to-date budget deficit to $184.1B versus a deficit of $236.9B during the first seven months of FY05.
A quirky 21.5% m/m drop in U.S. net outlays helped minimize the government's red ink. As a result of the drop the y/y growth in FYTD outlays fell to 5.7% from 8.7% one month earlier. Lower spending during April was logged by most outlay categories. Defense spending (19% of total outlays) reversed all of the prior month's surge and fell 21.6% (-10.9% y/y) and for the first seven months of FY06 rose 5.7% from '05.
Medicare spending (12% of total outlays) also reversed the March jump and fell by about half m/m. Still the FYTD growth in Medicare spending was strong at 7.9%, helped by the initiation of prescription drug coverage. Spending on social security (21% of total outlays) remained strong at 5.7%.
Net revenues nearly doubled m/m during April and that lifted growth to 11.2% during the first seven months of this fiscal year versus FY05. Individual income tax receipts (44% of total receipts) rose 13.8% from last April and that pulled FYTD growth to 9.9%. Corporate income taxes (10% of total receipts) similarly were strong and rose 28.0% y/y and rose 29.9% during fiscal year 06's first seven months.
The improved job market raised employment taxes (36% of total receipts) 7.4% y/y and estate & gift taxes surged by 13.1% y/y.
Presidential Approval Ratings: How Low Can Bush Go? from the American Enterprise Institute (AEI) can be found here.
Also from AEI is Taking Stock of Congress: A Lot of Bad to Go Around and it is available here.
| US Government Finance | April | Mar | Y/Y | FY 2005 | FY 2004 | FY 2003 |
|---|---|---|---|---|---|---|
| Budget Balance | $118.9B | $-85.5B | $57.7B (4/05) | $-318.3B | $-412.7B | $-377.6B |
| Net Revenues | $315.1B | $164.6B | 13.5% | 14.5% | 5.5% | -3.8% |
| Net Outlays | $196.2B | $250.0B | -10.8% | 7.8% | 6.2% | 7.4% |
by Tom Moeller May 10, 2006
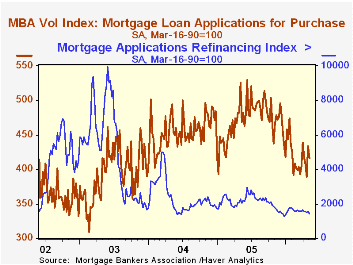
The total number of mortgage applications fell another 5.8% last week. It was the fourth decline during the last five weeks and pulled the opening level in May 2.0% below April which fell 1.1% from the March average.
Purchase applications gave back 3.9% w/w of an 11.3% recovery at the end of April. Nevertheless, at the start of May purchase applications were 1.1% ahead of April which rose 1.1% versus March.
During the last ten years there has been a negative 80% correlation between the interest rate level on 30-year financing and purchase applications while during those years there has been a 54% correlation between the y/y change in purchase applications and the change in new plus existing single family home sales.
An 8.8% w/w decline in applications to refinance lowered the level in early May 6.6% below the April average which fell 4.1% from March.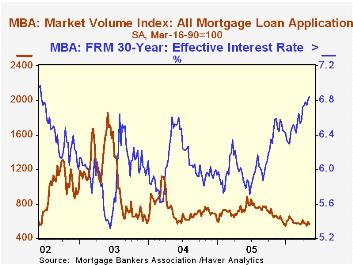
The effective interest rate on a conventional 30-year mortgage rose again to 6.84% from 6.81% at the end of April. The rate on 15-year financing similarly increased to 6.51%, the highest level since early 2002. Interest rates on 15 and 30 year mortgages are closely correlated (>90%) with the rate on 10 year Treasury securities and during the last ten years there has been a (negative) 82% correlation between purchase applications and the effective rate on a 30-Year mortgage.
The Mortgage Bankers Association surveys between 20 to 35 of the top lenders in the U.S. housing industry to derive its refinance, purchase and market indexes. The weekly survey accounts for more than 40% of all applications processed each week by mortgage lenders. Visit the Mortgage Bankers Association site here.
| MBA Mortgage Applications (3/16/90=100) | 05/05/06 | 04/28/06 | Y/Y | 2005 | 2004 | 2003 |
|---|---|---|---|---|---|---|
| Total Market Index | 562.1 | 596.8 | -28.0% | 708.6 | 735.1 | 1,067.9 |
| Purchase | 416.5 | 433.3 | -20.8% | 470.9 | 454.5 | 395.1 |
| Refinancing | 1,427.4 | 1,565.6 | -36.9% | 2,092.3 | 2,366.8 | 4,981.8 |
by Carol Stone May 10, 2006
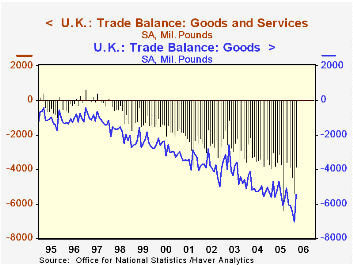
UK trade flows are strong. In both directions. A quick glance at today's March report would likely draw the most attention to a widening tendency in monthly deficit. The March figure, £3.84 billion, came down from February's £5.38 billion, but the general run has been toward larger gaps. See the first chart.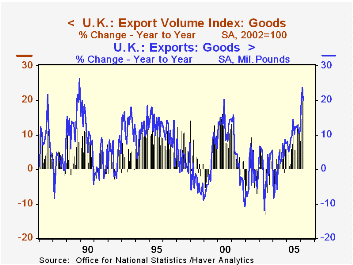
Nonetheless, the growth of exports as well as imports has been impressive. Exports are up13.7% from a year ago, with goods alone up 19.8%. Imports have risen 15.0%, with the goods portion up 18.9%. While some of this is a pick-up in prices, the volume indexes have also shown vigor: exports of goods are up 16.0% and imports, 13.3%.
Oil exports and imports are obviously up in value terms, and the trend may be shifting in the volume of oil exports. These are still below year ago amounts, but the one-month increase for March over February was a whopping 61.3%. Imports are quite erratic month-to-month, but for the first quarter as a whole, the amount of crude oil imported was 4.2% larger than in last year's first quarter. As seen in the table below, the overall "fuel" account recovered a bit in March from its recent unprecedented deficits. The recent high oil prices may be making it more economical for UK producers to raise the volume they pump, and indeed, the volume index for fuel, at 94 (2002=100) is the highest since last March, when it was 101.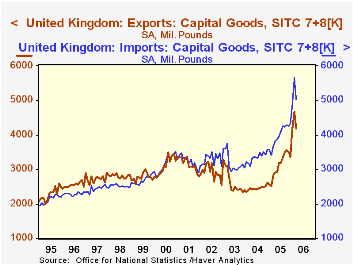
Non-oil trade has generally been on an upswing as well, and many countries are increasing their purchases from the UK. The ONS cautions that some of the apparent gains may be due to the results of VAT fraud investigations, but even so, their carefully worded text suggests that much of the gains are genuine. The ONS release is available here.
| UK Trade, SA, Bil.£ | Mar 2006 | Feb 2006 | Jan 2006 | Mar 2005 | Monthly Averages|||
|---|---|---|---|---|---|---|---|
| 2005 | 2004 | 2003 | |||||
| Trade Balance: Goods & Services | -3.84 | -5.38 | -4.45 | -3.04 | -3.91 | -3.25 | -2.58 |
| Exports | 29.29 | 28.81 | 28.68 | 25.76 | 26.33 | 24.49 | 23.52 |
| Imports | 33.12 | 34.20 | 33.13 | 28.80 | 30.23 | 27.74 | 26.10 |
| Goods | -5.46 | -7.05 | -6.14 | -4.72 | -5.47 | -5.04 | -3.99 |
| Fuels | -0.28 | -0.71 | -0.81 | 0.35 | -0.23 | 0.09 | 0.42 |
| Exports | 2.34 | 1.86 | 2.01 | 1.90 | 1.80 | 1.49 | 1.38 |
| Imports | 2.62 | 2.57 | 2.82 | 1.55 | 2.03 | 1.40 | 0.96 |
| Services | 1.62 | 1.66 | 1.96 | 1.68 | 1.56 | 1.79 | 1.41 |

Tom Moeller
AuthorMore in Author Profile »Prior to joining Haver Analytics in 2000, Mr. Moeller worked as the Economist at Chancellor Capital Management from 1985 to 1999. There, he developed comprehensive economic forecasts and interpreted economic data for equity and fixed income portfolio managers. Also at Chancellor, Mr. Moeller worked as an equity analyst and was responsible for researching and rating companies in the economically sensitive automobile and housing industries for investment in Chancellor’s equity portfolio. Prior to joining Chancellor, Mr. Moeller was an Economist at Citibank from 1979 to 1984. He also analyzed pricing behavior in the metals industry for the Council on Wage and Price Stability in Washington, D.C. In 1999, Mr. Moeller received the award for most accurate forecast from the Forecasters' Club of New York. From 1990 to 1992 he was President of the New York Association for Business Economists. Mr. Moeller earned an M.B.A. in Finance from Fordham University, where he graduated in 1987. He holds a Bachelor of Arts in Economics from George Washington University.
More Economy in Brief


