 Global| Feb 27 2007
Existing Home Sales Show Monthly Gain, Less Year/Year Weakness
Summary
Existing home sales had a surprising gain in January, rising 3.0% to 6.46 million (SAAR), the largest volume since June. Market forecasts called for an increase of just 0.5% or so. Note that all these data have undergone annual [...]
Existing home sales had a surprising gain in January, rising 3.0% to 6.46 million (SAAR), the largest volume since June. Market forecasts called for an increase of just 0.5% or so. Note that all these data have undergone annual seasonal revisions.
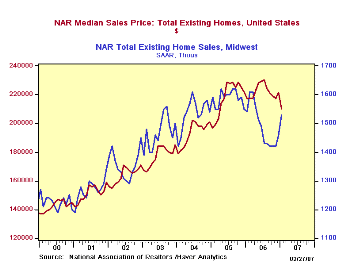
January is the weakest month seasonally, so we looked at the raw data to see if there was much exaggeration due to the low seasonal factors. Apparently not: the second graph here highlights that the greatest relative weakness in the existing home market was actually last summer, as the normal June seasonal peak was down 10.2% from June of the year before and the worst comparison was a whopping 16% in September. Now, the year-to-year loss is much smaller, just 2.7%.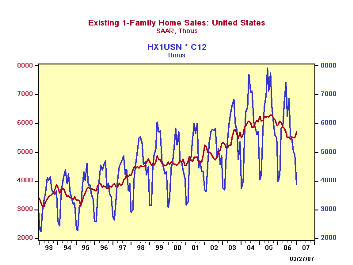
By region, sales remain "best" in the Northeast, where they are running 5.2% ahead of last year; they were flat with December after seasonal adjustment. Sales are also up on the year in the Midwest, 1.3%, and they gained 4.8% seasonally adjusted from December. In the South, volume is still down from last year, by 4.5%, but yearly comparisons show less weakness in prior months, so the whole down-cycle is more saucer-shaped there. January volume was up 2% from December. The far West is also still down, with January 9.4% below a year ago. They are less bad off now, though, than the 20%-plus plunge experienced back in the summer and January is actually up 5.6% from December.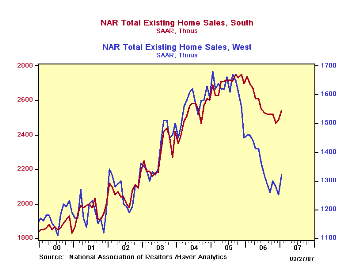
Home prices remain soft. The national median price was $210, 600, off 3.1% from a year ago. Prices in each region were also down, with the Midwest and the West showing the greatest softness, off 3.5% and 4.6% respectively. Those in the Northeast and the South were down just 1.2% and 1.7%. So market conditions in the West are still contracting, with both prices and volume down markedly from January 2006. Lower prices elsewhere might be seen as helping sales volumes stabilize or even turn upward.
| Existing Home Sales, | Jan 2007 | Dec 2006 | Nov 2006 | Yr/Yr% Chg (NSA) | 2006 | 2005 | 2004 |
|---|---|---|---|---|---|---|---|
| Total, 000s, SA | 6,460 | 6,270 | 6,250 | -2.7% | 6,510 | 7,075 | 6,727 |
| Median Price, NSA | $210,600 | $221,600 | $217,300 | -3.1% | $222,175 | $218,083 | $193,167 |
Carol Stone, CBE
AuthorMore in Author Profile »Carol Stone, CBE came to Haver Analytics in 2003 following more than 35 years as a financial market economist at major Wall Street financial institutions, most especially Merrill Lynch and Nomura Securities. She had broad experience in analysis and forecasting of flow-of-funds accounts, the federal budget and Federal Reserve operations. At Nomura Securities, among other duties, she developed various indicator forecasting tools and edited a daily global publication produced in London and New York for readers in Tokyo. At Haver Analytics, Carol was a member of the Research Department, aiding database managers with research and documentation efforts, as well as posting commentary on select economic reports. In addition, she conducted Ways-of-the-World, a blog on economic issues for an Episcopal-Church-affiliated website, The Geranium Farm. During her career, Carol served as an officer of the Money Marketeers and the Downtown Economists Club. She had a PhD from NYU's Stern School of Business. She lived in Brooklyn, New York, and had a weekend home on Long Island.
More Economy in Brief


