 Global| Jul 09 2008
Euro-Growth is a Tick Weaker in 2008-Q1
Summary
Euro Area GDP grew by 0.7 percent (simple Q/Q rate; also 2.9% saar) in the first quarter from the fourth quarter, and was up 2.1 percent year on year. The figures show a downward revision to provisional figures reported on June 3. [...]
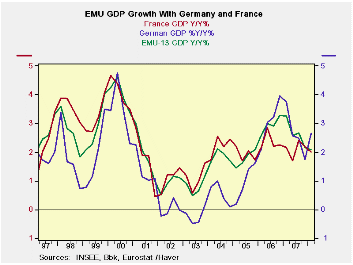
Euro Area GDP grew by 0.7 percent (simple Q/Q rate; also 2.9%
saar) in the first quarter from the fourth quarter, and was up 2.1
percent year on year. The figures show a downward revision to
provisional figures reported on June 3. Eurostat provisionally had put
first quarter growth at 0.8 pct quarter on quarter and 2.2 pct year on
year. The revisions themselves are small and inconsequential but hint
at things to come…
Government can only do so much…
The data in the table below shows that government spending
slowed in Q1 on a Yr/Yr basis but sped up Q/Q. A number of Euro-members
are having to be careful with fiscal outlays and mindful of the
constraint the EC Commission imposes on deficits relative to GDP,
especially as GDP slows. Even a strong quarter’s worth of government
spending did not boost the Yr/Yr result for the sector or maintain GDP
growth overall.
Domestic demand is slowing despite a good quarter
Domestic demand slowed in the zone Yr/Yr but surged in its Q/Q
growth. Here the Yr/Yr trend is more telling since domestic demand has
been tracing out a saw-tooth irregular pattern over the past four
quarters on a Q/Q basis. After posting Yr/Yr quarterly growth rates of
2% or more in recent quarters domestic demand dipped to 1.6% in
2008-Q1. In various EMU surveys the consumer sector continues to come
up as very weak. It has grown at a seemingly stable Yr/Yr pace of 2.1%
for the last two quarters while, in reality, the last two quarters of
growth on a quarterly basis were a very weak minus 0.3% (saar) in
2007-Q4 and a still anemic 0.7% (saar) in 2008-Q1.
Capital spending trends show some resilience but are still
challenged
Capital spending has been erratic as well. But at 2.9% Y/Y it
is only barely the weakest quarter in the past four. In quarterly
growth capital spending surged in Q1 and that may have had more to do
with the good weather than with economics. The surge abuts a very weak
1.6% growth pace for 2007-Q4. Its erratic nature makes its trend hard
to pin down. In surveys of industrial orders, however, it is clear that
the capital goods sector remains the strongest in the euro economy but
even it has begun to lose upward momentum.
Trade softens
Trade continues to augment GDP but its contribution to Q1
growth (Q/Q) was negative as the net export position turned negative
and registered a sharp slowdown from the previous quarter. Export
growth and import growth each made strong gains from the previous
quarter as imports grew faster, but Yr/Yr exports still have the edge
and on that basis trade boosted GDP growth again.
Got recession?
If imports continue to gain on exports as consumer demand is
fading the Euro Area could be challenged to maintain growth. In such an
environment it would be difficult to see capital spending holding up
and the capital goods sector is still the stalwart of the Euro Area.
But capital spending needs a reason and the reason in Europe is fading
as the currency is too strong to support export sales and domestic
demand is faltering, hampering domestic investment. On top of that,
overall world demand is simply slowing. The EMU economy is slowing too
and it is reasonable to ask if it will tip into recession, especially
given the ECB’s overriding concerns about inflation. We may soon see if
the ECB is very serious about its recent cautioning since has noted
that the risks to growth are on the downside. Indeed, they are.
| European GDP EU-15 | ||||||||||
|---|---|---|---|---|---|---|---|---|---|---|
| Consumption | Capital Formation | Trade | Domestic | |||||||
| GDP | Private | Public | Total | X Housing |
Housing | X-M: blns E |
Exports | Imports | Demand | |
| % change Q/Q; X-M is Q/Q change in Blns of euros | ||||||||||
| Q1-08 | 2.9% | 0.7% | 1.8% | 10.2% | 10.9% | 8.4% | -0.1 | 7.9% | 8.3% | 3.0% |
| Q4-07 | 1.5% | -0.3% | 0.6% | 1.6% | 2.0% | 0.6% | 5.8 | 1.7% | -1.0% | 0.3% |
| Q3-07 | 2.6% | 2.1% | 2.3% | 6.3% | 8.1% | 1.4% | -2.4 | 8.4% | 10.0% | 3.1% |
| Q2-07 | 1.4% | 2.5% | 0.9% | -5.9% | -6.2% | -5.2% | 5.9 | 3.9% | 1.1% | 0.2% |
| % change Yr/Yr; X-M is Yr/Yr change in Gap in Blns of euros | ||||||||||
| Q1-08 | 2.1% | 1.2% | 1.4% | 2.9% | 3.5% | 1.2% | 9.2 | 5.5% | 4.5% | 1.6% |
| Q4-07 | 2.2% | 1.2% | 2.0% | 3.9% | 5.5% | -0.1% | 4.4 | 4.4% | 4.0% | 2.0% |
| Q3-07 | 2.7% | 1.8% | 2.5% | 3.0% | 3.7% | 1.0% | 9.2 | 7.1% | 6.1% | 2.2% |
| Q2-07 | 2.6% | 1.8% | 2.3% | 3.3% | 3.8% | 1.7% | 7.8 | 6.0% | 5.2% | 2.2% |
| 5-Yrs | 2.2% | 1.6% | 1.8% | 3.6% | 3.8% | 3.2% | 0.5 | 6.0% | 5.8% | 2.1% |

Robert Brusca
AuthorMore in Author Profile »Robert A. Brusca is Chief Economist of Fact and Opinion Economics, a consulting firm he founded in Manhattan. He has been an economist on Wall Street for over 25 years. He has visited central banking and large institutional clients in over 30 countries in his career as an economist. Mr. Brusca was a Divisional Research Chief at the Federal Reserve Bank of NY (Chief of the International Financial markets Division), a Fed Watcher at Irving Trust and Chief Economist at Nikko Securities International. He is widely quoted and appears in various media. Mr. Brusca holds an MA and Ph.D. in economics from Michigan State University and a BA in Economics from the University of Michigan. His research pursues his strong interests in non aligned policy economics as well as international economics. FAO Economics’ research targets investors to assist them in making better investment decisions in stocks, bonds and in a variety of international assets. The company does not manage money and has no conflicts in giving economic advice.
More Economy in Brief


