 Global| Dec 02 2016
Euro Area PPI Accelerates As Oil Is the Catalyst
Summary
The PPI is off to the races. It is underpinned by oil and oil is underpinned by a new OPEC agreement. We will have to wait and see on OPEC which has in recent years talked a much better game than it has played. The cartel and friends: [...]
 The PPI is off to the races. It is underpinned by oil and oil is underpinned by a new OPEC agreement. We will have to wait and see on OPEC which has in recent years talked a much better game than it has played.
The cartel and friends: jawboning or real action?
Russia is part of this jawboneathon too. Russia has signed on for a 300K barrel per day output reduction but only after ramping up output to new local highs. The Russian cutback does not amount to much of a real -cutback by the time it is implemented from this higher level of output. And then there are questions of compliance for OPEC members. The OPEC cartel is unstable because everyone has an incentive to cheat- to say that they are cutting back but then when prices rise to produce more to collect higher sales at higher prices. However, of course, if that is done, it will undermine the artificial shortage created by the cartel and friends and the unplanned supply will drive prices back down.
Understanding the oil market
Oil is not a pure supply/demand market. What I mean by that is that the market does not know instantly if there is a surplus or not. There are pipelines and storage facilities and shipping lags and refineries that tune and retune seasonally to change their mix of output to more gasoline or to more heating oil and less gasoline. This labyrinth of transactors and the retuning process can be confusing to supply/demand and to the process of price discovery. Oil also has some special characteristics that prevent it from simply flowing unimpeded in all directions. Some oil is sold under contract and some is sold spot. Some oil is 'sweet'; some is 'sour'; some is 'heavy'; and some is 'light.' Oil generally must be shipped to a refinery equipped to handle the kind of oil it is. All this makes the oil market a bit more like a Japanese lunch box than you might have thought with various pools of oil going through pre-set accommodations. Because of all these complications, cheating is not immediately detectable in most cases. And knowing that someone is going to cut back output can affect the supply chain, but that effect will unwind if the cutback is not done as planned.
Much to watch
So when it comes to OPEC, we will have to watch to see if we will get real cutbacks and cutbacks that are of large enough dimension to drive oil prices where OPEC wants them. We will watch those outside the agreement like producers in the U.S. who are not bound to cut back and instead will expand; their added output will fill some of the gaps that OPEC cutbacks create. Will there be enough of that to blunt OPEC policies? We will watch all this closely because oil is a larger factor in the PPI, a much larger factor than for CPIs and the targeted HICP. Still, oil matters.
Europe's PPI trends
Turning to PPI trends in Europe, they are clearly up. But trends are not so clearly accelerating or doing so uniformly. In fact, the headline EMU PPI is expanding at a faster annual rate over six months than over three months. Only PPI consumer goods prices are accelerating on all three time horizons: three-month vs. six-month, six-month vs. 12-month, and 12-month vs. year ago.
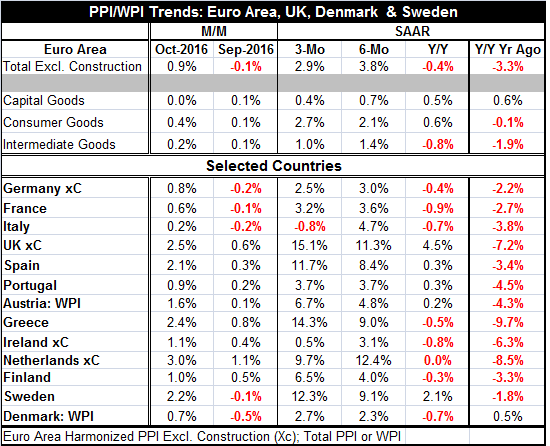
Country level trends
At the country level, the U.K., Spain, Austria, Greece, Finland, Sweden, and Denmark (seven of the 13 countries in the table) have PPI inflation rising from 12-month to six-month and from six-month to three-month. Year-over-year the PPI is still falling in seven countries and unchanged in one. Most people dwell on the year-over-year rates. But the shorter periods show how the trend is changing even if those horizons are subject to more variability and may give a wrong signal now and again.
Good solid signals
What we are seeing are likely good solid signals since they come with good breadth and will stay in place as long as the oil deal holds. The oil deal may fail, but there will be some period of time before we will be able to detect that.
Still, we can see where inflation is becoming entrenched.
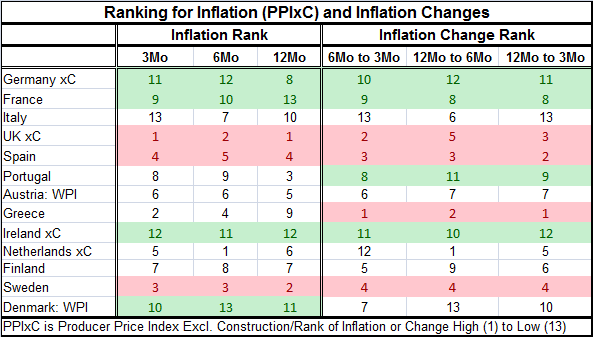
The table below ranks countries on the data in the table above. In it we rank countries on their inflation rates over three months, six months and 12 months among all other countries in the table (cross-section rankings) and we rank them on the change in their inflation rates from six-month to three-month and from 12-month to six-month as well as on the 12-month to three-month horizons. This table helps to point out where the inflation gateways are.
Inflation resistant
Perusing the table, there are some clear consistencies: Germany, France and Ireland have consistent high numbers implying a low rank for inflation pressures measured either as raw inflation rates or as changes in inflation rates. Denmark has consistently low inflation rates but has a bit more ambiguous change in inflation ranking over three months with a ranking of 7 (mid-pack) instead of low.
Inflation prone
The UK, Spain and Sweden have low numbers in the table implying a high inflation rate and change ranking.
Mixed trends
Portugal
Portugal is mixed with a low 12-month inflation rate but relatively high rates over three-month and six-month. In terms of changes, Portugal consistently ranks low as inflation is not picking over most horizons as fast it is for the rest of the countries in the table.
Italy and Greece
I come close to calling Italy a low inflation country; its inflation rankings are all low (high numbers) or moderate. The same is true of its inflation acceleration tendencies. Greece has some recent high inflation (low rankings) but with low inflation over 12 months; that combination leaves Greece with sharply accelerating inflation changes.
Summing up
Most EMU nations fare well
France has been able to stay with Germany in the inflation cool camp despite its budget problems. Spain is the only EMU country where prices and changes are hot consistently although Greece has an acceleration issue. Sweden is branded as hot. The U.K., with the pound falling sharply in the wake of its Brexit vote, has consistently hot inflation. The table tells various stories for other countries some are borderline hot or cold members.
Inflation is moving inexorably higher for everyone near term
But even for countries labeled as cold (or less hot/inflation resistant), inflation has been trending higher. Oil is pushing inflation up on this broad front. The EMU PPI rose by 0.9% m/m in October after a 0.1% decline in September. Obviously, conditions are in flux. But no country posted a PPI price decline in October and only five of 13 posted a decline in September and for only one of those was the drop greater than -0.2%.
How high the PPI how extended the rise?
The question for EMU is how high the PPI will go and then the question is if the oil underpinning will last and then if it will intensify. These are questions of OPEC's power and cohesiveness. As the chart shows, the transmission of inflation pressures from the PPI to HICP are not automatic and do not come except when the PPI has been rising substantially for an extended period. However the PPI is shedding much of its declining trend and we can see that that is already putting some air underneath the HICP. The transmission process has already begun. While I have told this primarily as an oil story, it is also one of other commodities and they tend to track with oil. There are obviously purely country-specific effects too as the different pass-through of oil inflation into domestic prices demonstrate. Some countries have a better structure to resist inflation (Germany and France) and some don't like Spain. The U.K. has an additional exchange rate issue. Of course, oil generates an 'inflation effect' through its relative price movements and they are temporary. The inflation impact wanes when oil prices stabilize as long as monetary policy holds to its path. And as we have seen, rising oil prices can be deflation for producer countries. But the risk here is that OPEC could generate more than one bump-up in oil prices and send several oil shocks through the system. The key to this is OPEC power and cohesiveness.

Robert Brusca
AuthorMore in Author Profile »Robert A. Brusca is Chief Economist of Fact and Opinion Economics, a consulting firm he founded in Manhattan. He has been an economist on Wall Street for over 25 years. He has visited central banking and large institutional clients in over 30 countries in his career as an economist. Mr. Brusca was a Divisional Research Chief at the Federal Reserve Bank of NY (Chief of the International Financial markets Division), a Fed Watcher at Irving Trust and Chief Economist at Nikko Securities International. He is widely quoted and appears in various media. Mr. Brusca holds an MA and Ph.D. in economics from Michigan State University and a BA in Economics from the University of Michigan. His research pursues his strong interests in non aligned policy economics as well as international economics. FAO Economics’ research targets investors to assist them in making better investment decisions in stocks, bonds and in a variety of international assets. The company does not manage money and has no conflicts in giving economic advice.
More Economy in Brief


