 Global| Jul 03 2007
EU PPI and Core Rise by 0.3% in May. Should the ECB be Worried?
Summary
The ECB, like the Fed, prefers to talk in terms of a price measure broader than the PPI. The PPI is just domestically produced goods and therefore omit import prices and services prices - services are a big missing piece in any [...]
The ECB, like the Fed, prefers to talk in terms of a price measure broader than the PPI. The PPI is just domestically produced goods and therefore omit import prices and services prices - services are a big missing piece in any economy. But since it is goods inflation that has been lowest and services inflation that has been more stubborn we do learn something by looking at goods prices alone.
The table below shows PPI on several different horizons. While the headline PPI is lower in March compared to April, the 3-month pace has not decelerated from the 6- month pace and ex-energy PPI has picked up and is accelerating compared to its Yr/Yr pace as well.
Producer prices just seem to have all sorts of stubbornness to them when it comes to looking for trends with a pace that is clearly falling.
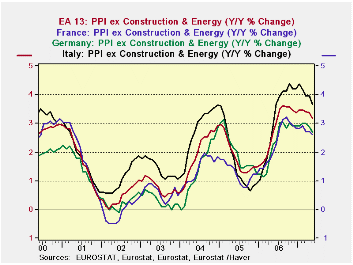
The bottom half of the table provides country level data and the Yr/Yr patterns for those appear in the chart on the left.
The ex-energy PPIs across key EU states show some disturbing patterns. Since end 2001 there have been three cycles of bulging PPI prices on this measure. Each time inflation went up, it made a new higher peak and each time it came down it made a new higher trough. This is creeping inflation pressure.
This is the sort of pattern in prices that makes central bankers lose sleep.
Is the new pattern turning lower? Well, yes but at a very stubborn rate and if you look at the pattern it looks more flat than round at the peak in recent months and is thereby begging the question of how much inflation will fall off. Clearly inflation is not falling in the post peak period as easily as it did in other episodes when it ultimately did not fall far enough.
| M/M | SAAR | |||||
| Ezone-13 | May-07 | Apr-07 | 3-Mo | 6-MO | Yr/Yr | Y/Y Yr Ago |
| Total excl Construction | 0.3% | 0.4% | 4.3% | 3.3% | 2.3% | 6.0% |
| Excl Energy | 0.3% | 0.4% | 3.8% | 3.6% | 3.2% | 2.7% |
| Capital Goods | 0.1% | 0.1% | 1.2% | 2.1% | 2.0% | 1.2% |
| Consumer Goods | 0.2% | 0.3% | 2.1% | 2.3% | 1.7% | 1.7% |
| Intermediate & Capital Goods | 0.3% | 0.5% | 4.8% | 4.5% | 4.1% | 3.2% |
| Energy | 0.5% | 0.3% | 6.3% | 2.4% | -0.5% | 18.6% |
| MFG | 0.4% | 0.7% | 6.7% | 4.6% | 2.5% | 4.2% |
| Germany | 0.3% | 0.1% | 2.7% | 1.9% | 1.9% | 6.2% |
| Total excl Energy | 0.2% | 0.5% | 3.3% | 2.8% | 2.7% | 2.3% |
| France | 0.0% | 0.4% | 2.5% | 2.2% | 1.4% | 4.2% |
| Total excl Energy | 0.2% | 0.3% | 2.2% | 2.4% | 2.6% | 2.0% |
| Italy | 0.4% | 0.5% | 5.5% | 3.9% | 3.0% | 6.6% |
| Total excl Energy | 0.3% | 0.4% | 4.2% | 4.3% | 3.7% | 2.9% |
| UK | -0.3% | -2.0% | -8.5% | -6.9% | -0.2% | 11.3% |
| Total excl Energy | 0.2% | 0.2% | 3.3% | 3.6% | 3.3% | 2.6% |
| E-zone 13 Harmonized PPI excluding Construction | ||||||
| The EA 13 countries are Austria, Belgium, Finland, France, Germany, | ||||||
| Greece, Ireland, Italy, Luxembourg, the Netherlands, Portugal, Slovenia | ||||||
by Tom Moeller July 3, 2007
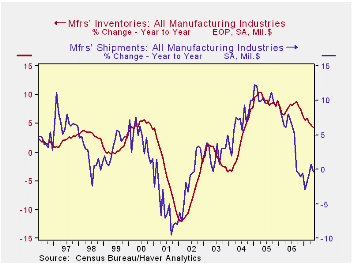
Factory inventories rose 0.4% during May after the moderate 0.4% gain in April. The gains left the y/y growth at 4.3%. Slower than the 6.4% rate of accumulation during all of 2006.
Much of the slowdown has occurred in inventories of computers & electronic products slowed to 4.3% y/y from a 10.4% rise in 2006. The y/y gain in electrical equipment inventories at 13.3% also is half the 25.2% rise last year.
Slower inventory growth follows the weakness in factory shipments which are down 0.4% y/y. Less the transportation sector shipments also are down 0.1% y/y.
Total factory orders do not paint a hold much promise for a robust recovery in shipments as they reversed in May all of a 0.5% gain during April.
Unfilled orders nevertheless remained strong posting y/y growth of 20.1%, about the same as last year’s strong rise.
| Factory Survey (NAICS) | May | April | Y/Y | 2006 | 2005 | 2004 |
|---|---|---|---|---|---|---|
| Inventories | 0.3% | 0.4% | 4.3% | 6.4% | 8.9% | 7.7% |
| New Orders | -0.5% | 0.5% | -0.1% | 5.1% | 11.6% | 6.9% |
| Shipments | 1.0% | 1.0% | -0.4% | 4.3% | 10.3% | 6.9% |
| Unfilled Orders | 0.9% | 1.9% | 20.1% | 20.0% | 15.0% | 3.9% |
by Tom Moeller July 3, 2007
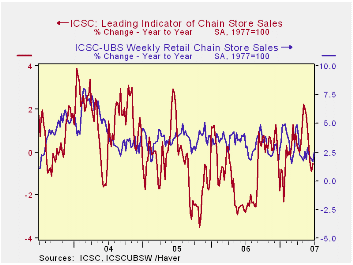
The ICSC-UBS retail chain-store sales index is constructed using the same-store sales (stores open for one year) reported by 78 stores of seven retailers: Dayton Hudson, Federated, Kmart, May, J.C. Penney, Sears and Wal-Mart.
The leading indicator of chain store sales from ICSC-UBS conversely rose 0.2% (-0.5% y/y) last week after a 0.6% decline during the prior period.
Stable Interest Rates Follow Stable Prices from the Federal Reserve Bank of St. Louis is available here.
| ICSC-UBS (SA, 1977=100) | 6/23/06 | 6/16/06 | Y/Y | 2006 | 2005 | 2004 |
|---|---|---|---|---|---|---|
| Total Weekly Chain Store Sales | 479.5 | 482.8 | 1.9% | 3.3% | 3.6% | 4.7% |
by Louise Curley July 3, 2007
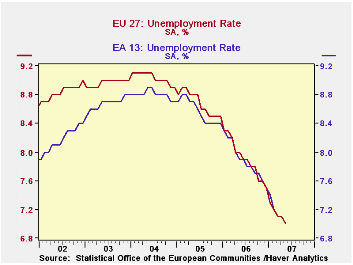
The unemployment rates for both the twenty-seven countries in the Euro Union and the thirteen countries in the subdivision--the Euro Area--declined to 7.0% in May from 7.1% in April. These rates are shown in the first chart.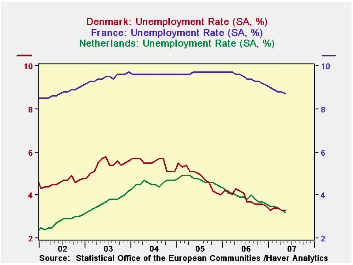
The concepts of the Euro Area and the European Union are useful for institutional purposes, but, from an economic standpoint, a better breakdown of the twenty-seven countries of the EU would be between developed and emerging economies. Thus, the non Euro Area countries, Denmark, Sweden and the United Kingdom have more in common with the developed countries of the Euro Area countries and Slovenia of the Euro Area has more in common with the eleven emerging countries: Bulgaria, the Czech Republic, Estonia, Cyprus, Latvia, Lithuania, Hungary, Malta, Poland, Romania, Slovakia.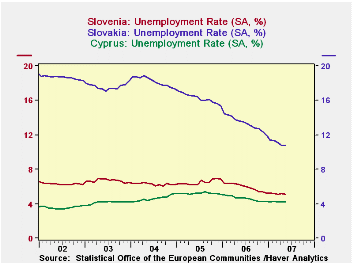
Among the developed countries unemployment rates currently vary from 3.2% in the Netherlands to 8.7% in France., both of which are Euro Area countries. Unemployment rates in Denmark, a non euro area country, have fallen within this range and have in recent years followed closely the same path at the unemployment rate in the Netherlands, as can be see in the second chart.
Among the emerging countries of the European Union, unemployment rates currently range from 4.2% in Cyprus to 10.8% in Slovakia. Unemployment rates in the emerging Slovenia, which is in the Euro Area, have tended to be near the lower limit of this range, as can be seen in the third chart.
| UNEMPLOYMENT RATES (%) | May 07 | Apr 07 | May 06 | M/M Dif | Y/Y Dif | 2006 | 2005 | 2004 |
|---|---|---|---|---|---|---|---|---|
| European Union 27 | 7.0 | 7.1 | 8.0 | -0.1 | -1.0 | 7.9 | 8.6 | 8.8 |
| Euro Area 13 | 7.0 | 7.1 | 7.9 | -0.1 | -0.9 | 7.9 | 8.3 | 9.0 |
| Developed Countries | ||||||||
| Highest: France | 8.7 | 8.8 | 9.6 | -0.1 | -0.9 | 9.5 | 9.7 | 9.6 |
| Lowest: The Netherlands | 3.2 | 3.3 | 3.9 | -0.1 | -0.7 | 3.9 | 4.7 | 4.6 |
| Denmark | 3.3 | 3.3 | 4.2 | 0.0 | -0.9 | 3.9 | 4.8 | 5.5 |
| Emerging Countries | ||||||||
| Highest: Slovakia | 10.8 | 10.8 | 13.6 | 0.0 | -2.8 | 13.3 | 16.3 | 18.2 |
| Lowest: Cyprus | 4.2 | 4.2 | 4.7. | 0.0 | -0.5 | 4.6 | 5.2 | 4.6 |
| Slovenia | 5.1 | 5.2 | 6.2 | -0.1 | -1.1 | 6.0 | 6.5 | 6.3 |

Robert Brusca
AuthorMore in Author Profile »Robert A. Brusca is Chief Economist of Fact and Opinion Economics, a consulting firm he founded in Manhattan. He has been an economist on Wall Street for over 25 years. He has visited central banking and large institutional clients in over 30 countries in his career as an economist. Mr. Brusca was a Divisional Research Chief at the Federal Reserve Bank of NY (Chief of the International Financial markets Division), a Fed Watcher at Irving Trust and Chief Economist at Nikko Securities International. He is widely quoted and appears in various media. Mr. Brusca holds an MA and Ph.D. in economics from Michigan State University and a BA in Economics from the University of Michigan. His research pursues his strong interests in non aligned policy economics as well as international economics. FAO Economics’ research targets investors to assist them in making better investment decisions in stocks, bonds and in a variety of international assets. The company does not manage money and has no conflicts in giving economic advice.
More Economy in Brief


