 Global| Jan 30 2020
EU Commission Indexes Begin Upturn for EMU--Can It Last?
Summary
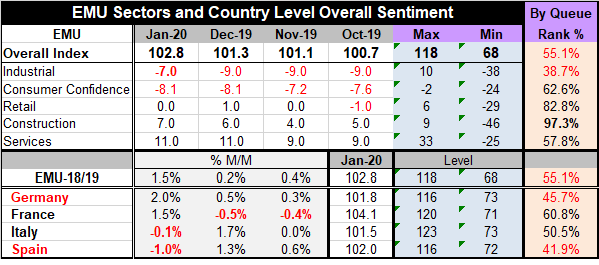
The table below excerpts from the full list of EMU members where only 6 of 18 reporting countries show declines in their EU Commission indexes in January (month-to-month) compared with 8 in December and 7 in November. The EMU index is [...]


The table below excerpts from the full list of EMU members where only 6 of 18 reporting countries show declines in their EU Commission indexes in January (month-to-month) compared with 8 in December and 7 in November. The EMU index is at a seven-month high and the four largest economics each show a turn up in their respective indexes. Is this the bottom after the correction?
Of course, this is the conclusion that everyone seeks. In the wake of the U.S.-China ‘phase one' trade deal, it is hoped that there is more of a spirt of cooperation and that will foster better economic conditions even as differences remain and negotiations continue. Will cooperation replace confrontation as we go ahead? What of Brexit? The European Parliament singing Auld Lang Syne after approving the Brexit paperwork from the U.K. is a good sign. But the U.S. and Europe still have negotiations and now there are other factors to consider. For one all trends do not point higher. The Baltic dry freight index is still scraping recent lows. The volume of world trade is not picking up.
Beware the geometric progression…coronavirus spreads
Moreover, the coronavirus is entering what appears to be a more virulent stage. Anyone familiar with a geometric progression knows what I refer to. It is not that the virus itself is becoming more potent. It is the critical mass of people infected is now larger and is growing extremely rapidly. That has happened not just because health authorities were lax, but because it took a while to discover that the disease spreads asymptomatically. Already the number infected with corona exceeds the number infected with SARS back when it was a threat. Every Chinese region now has an infection reported. Symptomless travelers have spread the virus globally and to what extent it is hard to say given the 14-day incubation period. Each person infected apparently has 14 days to wander around and infect others before it is known that he or she was at risk and was A RISK. By then, it is very late in the game of ‘stop-contagion.' Countries are now pulling their citizens out of Wuhan and China, bring them home and quarantining them before letting them mingle in society. Airlines are finally cancelling flights. And racism has emerged over this as ethnic Chinese people everywhere are seemingly being blamed or feared to be ‘carriers' even if they are residents and citizens in other nations. This is the really ugly side that laminates itself to the real risk of contagion and worsens its impact. So will all of the spreading virus and fears of spreading it further dominate the swing to improvement that we detect in the EU indexes… in steady U.S. GDP growth… and in the hint of better growth from slightly higher inflation being reported?
 EU trends and conditions
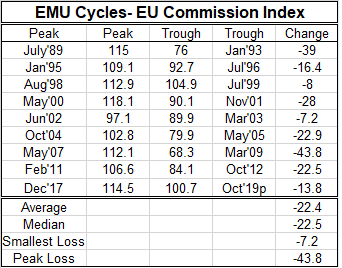
There have been nine cycle in the EU Commission index for the EMU with declines in the index ranging from as little as 7 or 8 points to as many as 39 and 43 points. In this cycle, the peak to trough (as of October) delineates a drop of 13.8 points less than the average or median in previous cycles. So far, this cycle is on the mild side. If the erosion ends here, central bankers will be able to take credit for having turned things around using scotch tape, staples and paper clips as their extraordinary measures substituted for old fashioned stimulus that had gone out of reach. These are measure they are now being pressured to put back on the shelf and to hide in the bottle they came in. But is this the end of the spiral? It can be hard to tell. One of the problems is that, while there is plenty of evidence of losing downward momentum, there is less evidence of a new upswing taking pace. So is this a plateau and will there be a second leg down or is this truly the end and the start of a new upcycle? That we do not know.
The EU Commission index scheme covers five different areas. Four sectors industry, retail, services and construction as well as a barometer of consumer confidence. There is also the overall sentiment index for the EMU as well as country-by-country versions. The table below looks at the four largest EMU economies plus the U.K. sector-by-sector. The current position of the various indexes is presented as a ranking in a queue of data from mid-1996 with the current standing displayed as a percentile in that queue of results for each index. As a benchmark, understand that the median of each index occurs at a ranking of 50%. These are NOT diffusion indexes (they are rankings of diffusion indexes). A standing of 50% represents the median reading for each indicator. Any reading above 50% is above its median; readings below 50% are sub-median but some (many) will still reflect periods of growth.
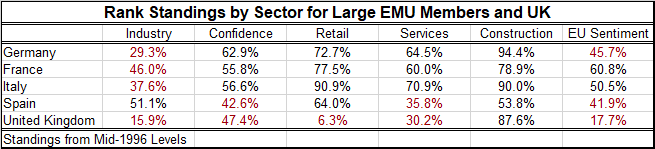
Of the 30 entries in the table, 11 are below 50% indicating below median growth. That is roughly 37% of sectors with subpar growth by country. By sector, only construction shows no subpar readings. And retailing shows only one below par reading among the five largest economies. Services and consumer confidence show two subpar readings across these economies while manufacturing is subpar everywhere except in Spain and that exception is by a thin margin. By country, the U.K. is clearly the weakest as it grapples with life after Brexit with subpar readings in all sectors except construction. Spain has two subpar readings the consumer confidence barometer and the services sector, while Italy, France and Germany the three largest EMU economies each show only one subpar sector. However, the German industrial reading is so weak; its overall sentiment reading also is subpar along Spain and the U.K.
Setting the U.K. aside for its special situation as well as because it is not an EMU member, what is left in the EMU is an across-the-board weak if not subpar manufacturing sector, mildly positive consumer confidence, mostly firm services, strong retailing with generally even stronger construction. Still, given the weights assigned to these sectors two EMU members have subpar overall sentiment and Italy is barely above its median reading on sentiment. Sentiment only looks solid in France.
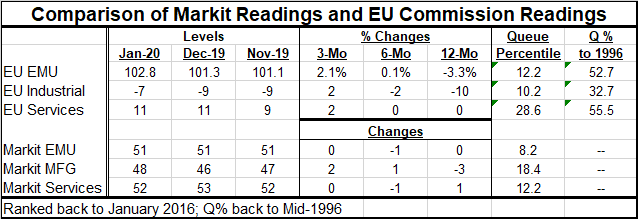
We can further compare the EMU readings to those of the Markit sector indexes. What this side-by-side comparison shows is that based on 12-month changes, EMU data show year-on-year declines for the overall EMU index for the industrial sector and a flat reading for services. The Markit overall reading is flat for the EMU, lower for manufacturing and slightly higher for services. The two approaches agree on the industrial sector and have modest differences for overall and for services. The queue percentile standings since 2016 show weaker standings under the Markit scheme for the overall and for services while the industrial sector is evaluated weaker by the EU indexes on that timeline. These queue standings compare the ranking of each index for the same timeline using the two different schemes. The EU Commission data are available on a longer timeline than Markit and on that extended comparison back to 1996 all the EU evaluations of current data standings are higher. In other words, on the EU approach the period for 2016 forward is generally stronger than the full sample period so when data are evaluated only on the short timeline they appear weaker relative to this stronger period. That result is supportive of the finding above that EU Commission index has had a relatively mild correction so far in comparison with past corrections.
All this looking backward and comparing with other surveys is useful to check and double check where we stand compared to other historic periods and on how severe the downturn looks. It is also very useful getting a sector opinion from a ‘similar survey.
But nothing among of comparisons will reveal the future. Econometric models operate on the assumption that the past is like the future or that its relationship is shifting in some knowable way. And that may be true or not.
We are in an extremely long economic expansion from a very severe economic contraction and that makes comparison with the past less even handed. There has been major trade conflict between the U.S. and China and enormous tariffs are still in place. Also the U.S. is trying to change the deal it got in previous tariff negotiations so there is a clear element of noncomparability with the past embedded in this process. There are also ongoing negotiations over matters that both the U.S. and China deem as important and these are issues they could not easily agree on in their phase-one deal. The U.S. feels strongly that China is still acting unfairly and seeks to redress that situation while China has not disagreed but it has couched much of its reluctance to compromise in its defense of its own sovereignty. None of this makes me feel complacent about prospects. How does a capitalist economy fairly trade with a communist country where firms are publically owned and financial support comes from the state instead of from the market at market prices? What is fair? If the communist country runs a huge structural trade surplus, is that in itself an indication of unfairness?
While today's U.S. GDP result was not as weak as feared, it was boosted by government spending and plunging imports, Hong Kong, beset with a variety of its own special problems, had the largest import drop in a decade. The Baltic dry index tells us that trade flows are not yet responding positively. It is unclear how much the coronavirus will impact trade per se and economic activity in general. Will food exports/imports be embargoed due to fears of contagion? We know very little about this virus' contagion properties.
It is far too soon to jump on the improvement this month of the EU Commission index or to look at some of the recent strength in prices that stems from some past increases in oil prices that have since been unwound - also due to virus fears. Stocks are lower on virus fears. Bond yields are lower on virus fears. There is a good reason to be wary of incoming data. In part that is because what they are now may not be a good representation of what they will be.

Robert Brusca
AuthorMore in Author Profile »Robert A. Brusca is Chief Economist of Fact and Opinion Economics, a consulting firm he founded in Manhattan. He has been an economist on Wall Street for over 25 years. He has visited central banking and large institutional clients in over 30 countries in his career as an economist. Mr. Brusca was a Divisional Research Chief at the Federal Reserve Bank of NY (Chief of the International Financial markets Division), a Fed Watcher at Irving Trust and Chief Economist at Nikko Securities International. He is widely quoted and appears in various media. Mr. Brusca holds an MA and Ph.D. in economics from Michigan State University and a BA in Economics from the University of Michigan. His research pursues his strong interests in non aligned policy economics as well as international economics. FAO Economics’ research targets investors to assist them in making better investment decisions in stocks, bonds and in a variety of international assets. The company does not manage money and has no conflicts in giving economic advice.
More Economy in Brief


