 Global| Sep 15 2005
Energy in China
Summary
China's National Bureau of Statistics published energy production data today for August. Their statisticians convert various forms of energy to a coal-equivalent volume. In August, total energy output amounted to 154.28 million tonnes [...]
China's National Bureau of Statistics published energy production data today for August. Their statisticians convert various forms of energy to a coal-equivalent volume. In August, total energy output amounted to 154.28 million tonnes of "standard coal", up 14.1% from a year ago. Several factors are notable about the role of energy in China.
China uses much more coal than oil. Data for the year 2004 show coal accounting for 67.7% of energy consumption, compared with crude oil at just 22.7%. In the US, by contrast, where comparative energy statistics are expressed in quadrillion BTUs, coal accounted for 22.3% last year and oil, 40.5%. Natural gas, used just marginally in China, with 2.6% of consumption, is a major source in the US, providing 23.1% of energy.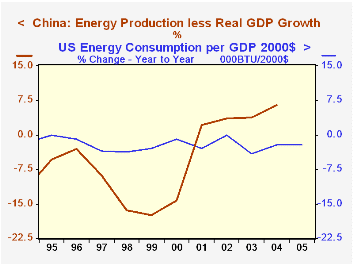
Another notable difference with the US is in energy efficiency. In the US, the number of BTU needed to produce a dollar of GDP (in real terms) has fallen steadily since the early 1970s (see second graph), while in China, the opposite trend applies. GDP growth in 2003 and 2004 was 9.5%, but energy production increased by 13.3% in 2003 and 15.9% last year. Some moderation is seen in the latest couple of months, but August's 14.1% expansion is surely still much stronger than GDP growth. A fast glance at various other measures of Chinese economic activity suggests that process of development is possibly the origin of this movement, not that Chinese people and businesses are becoming more profligate energy users. Automobile sales are rising rapidly as is business investment. Construction of infrastructure and heavy manufacturing activity take considerable power.
So it is not just China's rapid growth that is adding to world demand for energy, but the more intense use of energy in the modern Chinese economy.
| Aug 2005 | July 2005 | June 2005 | 2004 | 2003 | 2002 | |
|---|---|---|---|---|---|---|
| Energy Production (Mil Ton SCE*) |
Annual Total | |||||
| 1556.0 | 1342.0 | 1184.2 | ||||
| 154.28 | 152.91 | 156.58 | Monthly Average | |||
| 129.66 | 111.83 | 98.68 | ||||
| Yr/Yr % Change | 14.1% | 14.8% | 15.9% | 15.9% | 13.3% | 11.9% |
| Coal Production (Mil Ton) | 153.96 | 151.76 | 158.60 | 130.43 | 109.60 | 92.34 |
| Yr/Yr % Change | 16.2% | 15.4% | 17.1% | 19.0% | 18.7% | 15.4% |
| Refined Crude Oil | 24.23 | 24.62 | 23.80 | 22.88 | 20.15 | 18.28 |
| Yr/Yr % Change | 3.2% | 7.4% | 5.8% | 13.5% | 10.2% | 4.2% |
Carol Stone, CBE
AuthorMore in Author Profile »Carol Stone, CBE came to Haver Analytics in 2003 following more than 35 years as a financial market economist at major Wall Street financial institutions, most especially Merrill Lynch and Nomura Securities. She had broad experience in analysis and forecasting of flow-of-funds accounts, the federal budget and Federal Reserve operations. At Nomura Securities, among other duties, she developed various indicator forecasting tools and edited a daily global publication produced in London and New York for readers in Tokyo. At Haver Analytics, Carol was a member of the Research Department, aiding database managers with research and documentation efforts, as well as posting commentary on select economic reports. In addition, she conducted Ways-of-the-World, a blog on economic issues for an Episcopal-Church-affiliated website, The Geranium Farm. During her career, Carol served as an officer of the Money Marketeers and the Downtown Economists Club. She had a PhD from NYU's Stern School of Business. She lived in Brooklyn, New York, and had a weekend home on Long Island.
More Economy in Brief


