 Global| Sep 22 2006
Energy & Gold Prices Deflate
by:Tom Moeller
|in:Economy in Brief
Summary
At $61.05 yesterday for a barrel of WTI crude oil, the price has fallen 21% from this past summer's peak of $77.00.That decline has been accompanied by a 38% decline in the spot price for unleaded gasoline to $1.51 per gallon from [...]
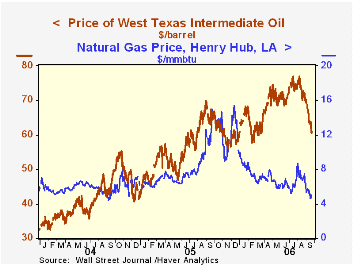
At $61.05 yesterday for a barrel of WTI crude oil, the price has fallen 21% from this past summer's peak of $77.00.That decline has been accompanied by a 38% decline in the spot price for unleaded gasoline to $1.51 per gallon from $2.42 in July.
A lessening of supply concerns seems to more explain the price drop. Demand for gasoline actually has strengthened of late with y/y growth up to 5.4% during mid-September, according to figures from the U.S. Department of Energy.
Natural gas prices similarly have fallen sharply with the spot price down to $4.67/mmbtu, off by nearly one-half from this past July's high. During September, the Edison Electric Institute reports that growth in U.S. electricity demand was negative 5-11% y/y.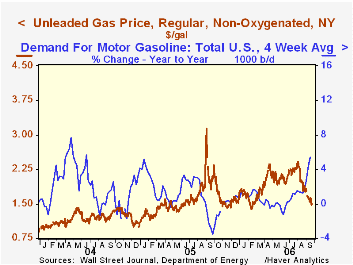
Gold prices have followed suit with a 20% decline to $578.75 per ounce versus the May high of $725.00. Reduced concerns about future inflation certainly figure in the price decline. Federal Reserve Board action has left the level of the monetary base virtually unchanged since the Spring with y/y growth down to 3.3%, near the lows of the last four years.An additional indication of reduced inflation risk is the Treasury market interest rate yield curve which remains inverted between the 10 Year and Fed funds.
Other commodity prices similarly have lost steam. The JoC-ECRI index of industrial metals prices has been volatile in a sideways pattern since the Spring though textile prices recently firmed off a low July base. Lower lumber prices reflect the declines in housing starts & sales. The framing lumber composite from FIBER near $300/1000 board ft. is off by nearly one third from last year's high.During the last twenty years there has been a 35% correlation between the y/y change in factory sector industrial production and the change in the crude goods Producer Price Index less food & energy.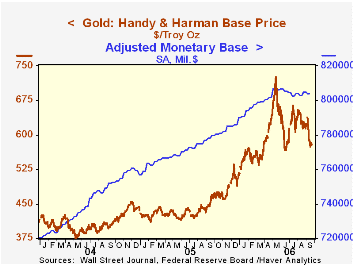 Inflation, Inflation Expectations, and Monetary Policy from the Federal Reserve Bank of Cleveland can be found here.
Monetary Policy in an Interdependent World from the Federal Reserve Bank of Cleveland is available here.
| Weekly Prices | 09/21/06 | 12/30/05 | Y/Y | 2005 | 2004 | 2003 |
|---|---|---|---|---|---|---|
| Light Sweet Crude Oil, WTI (per bbl.) | $61.05 | $61.04 | -8.2% | $58.16 | $41.78 | $32.78 |
| Gold: Handy & Harmon (per Troy Oz.) | $578.75 | $516.00 | 24.1% | $507.40 | $443.40 | $416.25 |
by Carol Stone September 22, 2006
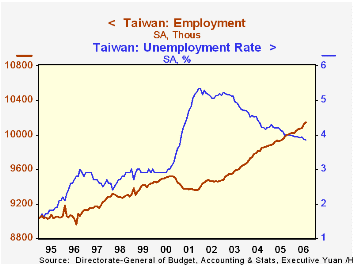
Employment in Taiwan is trending steadily higher, even and especially in the manufacturing sector. August data published on September 22 by the Directorate-General for Budgets, Analysis and Statistics (DGBAS) shows a 21,000 increase in total employment in the month, a 2.0% advance over a year ago and following a 42,000 increase in July. Unemployment in Taiwan is declining, and the August rate, 3.8%, is the lowest since February 2001; it peaked at 5.3% in early 2002.
The most distinctive aspect to Taiwan's labor situation is the uptrend in manufacturing. The number of factory workers has increased by 61,000 over the last year, a gain of 2.2%. After the tech recession in 2001, Taiwan's manufacturing rebounded promptly and has shown fairly consistent growth since. Its neighbors haven't fared nearly as well. Until the last few months, South Korea has continued to see job reductions in that sector and Hong Kong's manufacturing jobs are just managing to hold steady at their cycle low.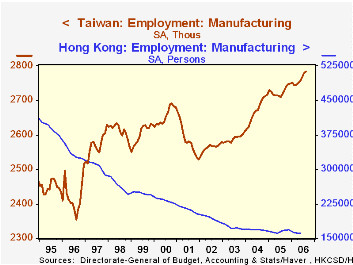
Clearly too, Taiwan's manufacturing employment is stronger than in the West. In Taiwan, this key goods-producing sector accounts for just over 27% of all employment. This contrasts with 18.4% recently in the EuroZone (includes mining), about 12% in the US and 11% in the UK. In Europe, too, factory jobs are falling markedly; in the UK, they are also falling, although the rate of decline is easing. In the US, total factory employment has finally stabilized and the number of production workers is actually rising a bit. But by far, Taiwan's sector is out-performing many other of the world's markets.
| Taiwan: SA*, 000s | Aug 2006 | July 2006 | June 2006 | Year Ago | 2005 | 2004 | 2003 |
|---|---|---|---|---|---|---|---|
| Total Employment | 10,141 | 10,120 | 10,078 | 9,951 | 9,942 | 9,786 | 9,573 |
| Change/ % Chg | 21 | 42 | 7 | 2.0% | 1.6% | 2.2% | 1.3% |
| Manufacturing | 2,783 | 2,777 | 2,765 | 2,722 | 2,726 | 2,672 | 2,590 |
| Change/ % Chg | 6 | 12 | 9 | 2.2% | 2.0% | 3.2% | 1.0% |
| Unemployment Rate, % | 3.8% | 3.9% | 3.9% | 4.1% | 4.1% | 4.4% | 5.0% |

Tom Moeller
AuthorMore in Author Profile »Prior to joining Haver Analytics in 2000, Mr. Moeller worked as the Economist at Chancellor Capital Management from 1985 to 1999. There, he developed comprehensive economic forecasts and interpreted economic data for equity and fixed income portfolio managers. Also at Chancellor, Mr. Moeller worked as an equity analyst and was responsible for researching and rating companies in the economically sensitive automobile and housing industries for investment in Chancellor’s equity portfolio. Prior to joining Chancellor, Mr. Moeller was an Economist at Citibank from 1979 to 1984. He also analyzed pricing behavior in the metals industry for the Council on Wage and Price Stability in Washington, D.C. In 1999, Mr. Moeller received the award for most accurate forecast from the Forecasters' Club of New York. From 1990 to 1992 he was President of the New York Association for Business Economists. Mr. Moeller earned an M.B.A. in Finance from Fordham University, where he graduated in 1987. He holds a Bachelor of Arts in Economics from George Washington University.
More Economy in Brief


