 Global| Aug 13 2009
EMU GDP Falls But French And German GDP Rise
Summary
European growth figures continue to be weak when we log the indicators month by month but if instead we complete a formal GDP presentation, Germany and France have exited recession while the EMU GDP drop is only -0.1% in Q2 of 2009, a [...]
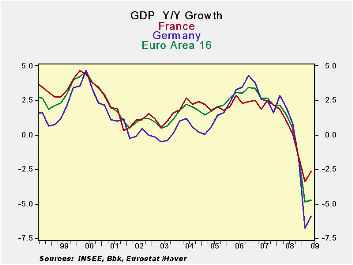
European growth figures continue to be weak when we log the
indicators month by month but if instead we complete a formal GDP
presentation, Germany and France have exited recession while the EMU
GDP drop is only -0.1% in Q2 of 2009, a drop at an annual rate of
-0.4%. EMU’s GDP decline in Q2 is less than the drop in the US but
Europe’s Yr/Yr decline has been worse at -4.7% compared to the US
year-over-year loss of -3.9%.
In the US the Fed is less downbeat - At
its meeting yesterday the Fed implied that the recession in the US was
ending but did not take the step of saying in any clear voice that
recovery was beginning. It issued in a vague voice the statement saying
that activity was leveling off. In Q2 some of Europe, at least, is
doing better than that.
GDP as the standard - The contrast
between what GDP sees and what monthly indicators show is an important
one to keep in mind. GDP accounting has its peculiar elements. Fewer
imports boost GDP even though there is no direct impact on domestic
output (there is less bought from abroad and so fewer payments made to
foreigners- all things equal fewer imports mean higher sales by
domestic agents for the same GDP). And inventories cut at slower pace,
add to GDP growth even though they are still being cut.
Indicators can lag - Jobs tend to trail
activity shifts so the economy will be in recovery before job growth is
even positive. In the case of Europe its purchaser induces and the EU
Economic indicators from the EU Commission are woefully weak and seem
inconsistent with the notion that the recession is ending even if just
in Germany and France. But that is the way recessions sometimes end.
Indicators really do lag in this cycle -
To put it differently early recovery periods often do not look very
different from end recession periods. That is not surprising because
they are chronological neighbors. What makes recovery so different is
where it is headed compared to the recession period. Even so, the
indicators of economic performance in Europe are uncharacteristically
weak for the recession to be ending. Even those in Germany and in
France are lacking. The GDP rebounds hardly seems like they can be from
the same countries as the ones that have produced the indicators they
have up to mid-year.
What indicators have been telling us- To
begin with we have no detail on GDP in Europe just the few things that
might be said at press conferences where the data are released.
Industrial data in EMU as well as in Germany and France, in particular,
continue to be very weak. The German and French economic sentiment
readings which are a weighted average of the EU Commission’s underlying
sector indices rank in the bottom 20th percentile of their respective
rage of values. The German and French readings are up about 10% or so
from their weakest readings in the recession on this score. The EU
Commission indices are from underlying diffusion data. All continue to
show deep contractions across are all sectors. Germany and France show
GDP that is rising, nonetheless. Apparently the change in the EMU index
is more important that the level of the index even though it is a
diffusion index that has to turn positive to signal sector growth and
all sectors industrial, retail, services, construction and consumer are
weak.
German’s IFO - Germany has its own IFO
survey with a diffusion component and for July its services reading
just barely turned positive.
More indicators - The NTC/Markit readings
are ISM type readings where a level above 50 denotes expansion. For EMU
in June the NTC reading stood at 42.4 for MFG and 44.5 for Services.
Both of these indices register declines as they are below 50. For
Germany, an economy that is showing positive GDP growth in Q2, its
NTC/Market diffusion index stood at 40.8 and was ins the bottom 40
percentile of its range of readings. France at 45.9 also signaled a
declining MFG sector but its index was closer to neutral standing in
the 49th percentile of its range, despite its low raw diffusion level.
The service sectors in France and Germany were weak in June as well,
with raw diffusion readings 45 and 47 respectively. Those readings
ranked in the lower third of each country’s respective historic
experience.
GDP does not seem to have widespread support -
In short the industrial data and service sector data we have do not
confirm the message from GDP in EMU. We could go through a litany of
consumer confidence data as well, as they are weak too. If Europe is
recovering (France and Germany, any way) it must be the government
spending that is boosting the economy coupled with lower imports and
inventories that are being cut by less than before –all these are what
I would terms passive augmentations of GDP. The active augmentation
from more consumer spending and more business investment has not begun.
Inventories are likely adding to GDP growth but not by actively being
built.
Exports and government are probably the main drivers -
We have seen episodic country reports that have revealed exports have
begun to rise. So the economies that are in recovery may now be firing
on two cylinders exports and the government sector. It’s not a very
wide base for growth yet. But it is also the support within EMU that is
helping to cut the drop in the formal measure of GDP. Progress is being
made but it does look like the sort of progress that usually marks the
ends of recessions. Too many European, German and French sectors are
just too weak.
| E-Area and main G-10 country GDP Results | |||||||
|---|---|---|---|---|---|---|---|
| Quarter over quarter-Saar | Year/Year | ||||||
| GDP | Q2-09 | Q1-09 | Q4-08 | Q2-09 | Q1-09 | Q4-08 | Q3-08 |
| EMU-15 | -0.4% | -9.7% | -6.9% | -4.7% | -4.9% | -1.7% | 0.5% |
| Austria | #N/A | -3.3% | -3.9% | #N/A | -3.4% | 0.2% | 2.0% |
| France | 1.4% | -5.3% | -5.5% | -2.6% | -3.4% | -1.6% | 0.1% |
| Germany | 1.3% | -13.4% | -9.4% | -5.9% | -6.7% | -1.8% | 0.8% |
| Greece | 1.3% | -4.7% | 1.2% | -0.2% | 0.3% | 2.4% | 2.7% |
| Italy | -1.9% | -10.3% | -8.3% | -6.0% | -6.0% | -3.0% | -1.3% |
| The Netherlands | -3.4% | -10.3% | -4.1% | -4.9% | -4.2% | -0.8% | 1.7% |
| Portugal | #N/A | -6.2% | -7.1% | #N/A | -3.7% | -2.0% | 0.3% |
| Spain | #N/A | -7.4% | -3.8% | #N/A | -3.0% | -0.7% | 0.9% |
| UK | -3.1% | -9.2% | -7.0% | -5.6% | -4.9% | -1.8% | 0.5% |
| US | -1.0% | -6.4% | -5.4% | -3.9% | -3.3% | -1.9% | 0.0% |
| Japan | #N/A | -14.2% | -13.5% | #N/A | -8.4% | -4.4% | -0.3% |
| Switzerland | #N/A | -3.2% | -2.2% | #N/A | -1.6% | -0.4% | 1.2% |

Robert Brusca
AuthorMore in Author Profile »Robert A. Brusca is Chief Economist of Fact and Opinion Economics, a consulting firm he founded in Manhattan. He has been an economist on Wall Street for over 25 years. He has visited central banking and large institutional clients in over 30 countries in his career as an economist. Mr. Brusca was a Divisional Research Chief at the Federal Reserve Bank of NY (Chief of the International Financial markets Division), a Fed Watcher at Irving Trust and Chief Economist at Nikko Securities International. He is widely quoted and appears in various media. Mr. Brusca holds an MA and Ph.D. in economics from Michigan State University and a BA in Economics from the University of Michigan. His research pursues his strong interests in non aligned policy economics as well as international economics. FAO Economics’ research targets investors to assist them in making better investment decisions in stocks, bonds and in a variety of international assets. The company does not manage money and has no conflicts in giving economic advice.
More Economy in Brief


