 Global| Mar 08 2002
Employment Rose More Than Expected
by:Tom Moeller
|in:Economy in Brief
Summary
Nonfarm payrolls rose much more than expected last month, although job loss in January was revised deeper due to a deepened estimate of cuts in the factory sector. Consensus estimates had been for no change in February payrolls. It [...]
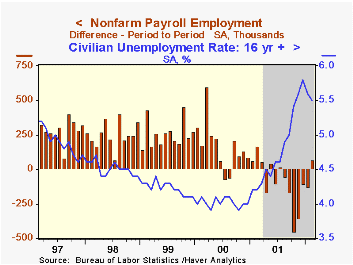
Nonfarm payrolls rose much more than expected last month, although job loss in January was revised deeper due to a deepened estimate of cuts in the factory sector. Consensus estimates had been for no change in February payrolls.
It was the first gain in payrolls since last July. The breadth of job gain improved as indicated by the one month diffusion index rising to 48.2, the highest level since March.
From the household survey, the unemployment rate fell to its lowest level since October.
The median duration of unemployment fell sharply to 8.1 weeks from 8.8 weeks in January. That was still up versus 6.0 weeks last February.
Factory sector jobs continued to fall with losses in the industrial machinery, electronic equipment and nondurable sectors. Nevertheless, the one month diffusion index for the factory sector improved to 40.8 versus a low of 25.7 in November.
Construction sector jobs rose 25,000 (-1.0% y/y) following a 63,000 loss in January.
Employment in the service sector rose 97,000 (0.1% m/m) led by strong gains at general merchandise stores. Employment in many other service sectors fell.
The index of aggregate hours worked (employment times hours worked) rose 0.1%. The Jan-Feb average is 1.1% (AR) below 4Q.Aggregate hours continued to fall in the factory sector.
Average hourly earnings were little changed versus consensus expectations for a 0.3% gain, but January was revised up from no change.
The employment figures for nonfarm payrolls are based on reports provided to the US Labor Department by businesses, while the figures from which the unemployment rate is derived are based on a survey of US households.
| Employment | Feb | Jan | Y/Y | 2001 | 2000 | 1999 |
|---|---|---|---|---|---|---|
| Payroll Employment | 66,000 | -126,000 | -1.0% | 0.4% | 2.2% | 2.4% |
| Manufacturing | -50,000 | -110,000 | -7.2% | -4.2% | -0.5% | -1.3% |
| Average Weekly Hours | 34.1 | 34.1 | 34.3 | 34.2 | 34.4 | 34.5 |
| Average Hourly Earnings | 0.1% | 0.2% | 3.7% | 4.2% | 3.8% | 3.6% |
| Unemployment Rate | 5.5% | 5.6% | 4.2% | 4.8% | 4.0% | 4.2% |

Tom Moeller
AuthorMore in Author Profile »Prior to joining Haver Analytics in 2000, Mr. Moeller worked as the Economist at Chancellor Capital Management from 1985 to 1999. There, he developed comprehensive economic forecasts and interpreted economic data for equity and fixed income portfolio managers. Also at Chancellor, Mr. Moeller worked as an equity analyst and was responsible for researching and rating companies in the economically sensitive automobile and housing industries for investment in Chancellor’s equity portfolio. Prior to joining Chancellor, Mr. Moeller was an Economist at Citibank from 1979 to 1984. He also analyzed pricing behavior in the metals industry for the Council on Wage and Price Stability in Washington, D.C. In 1999, Mr. Moeller received the award for most accurate forecast from the Forecasters' Club of New York. From 1990 to 1992 he was President of the New York Association for Business Economists. Mr. Moeller earned an M.B.A. in Finance from Fordham University, where he graduated in 1987. He holds a Bachelor of Arts in Economics from George Washington University.
More Economy in Brief


