 Global| Aug 03 2005
Employee Discounts Spurred U.S. Vehicle Sales
by:Tom Moeller
|in:Economy in Brief
Summary
US sales of light vehicles were spurred in July as a result of aggressive price discounts offered by car manufacturers. The program titled "employee discounts" raised the selling rate to 20.86M, its highest since October 2001 [...]
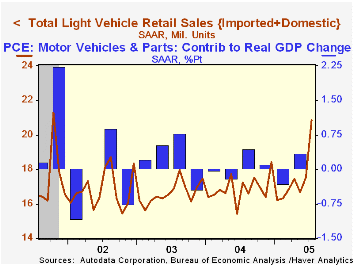
US sales of light vehicles were spurred in July as a result of aggressive price discounts offered by car manufacturers. The program titled "employee discounts" raised the selling rate to 20.86M, its highest since October 2001 according to the Autodata Corporation.
Sales of US made cars and trucks jumped 22.1% m/m and 23.3% y/y. The gain was led by a 27.3% m/m jump in sales of domestically made trucks while car sales rose 12.9%.
Sales of imported cars & trucks also posted a strong 6.4% m/m gain last month to the highest level this year though imports' share of the US market for new vehicles fell sharply to 17.5%, the lowest since 2002.
Overall auto sales jumped 10.7% m/m and truck sales surged 24.9%.
| Light Vehicle Sales (SAAR, Mil. Units) | July | June | Y/Y | 2004 | 2003 | 2002 |
|---|---|---|---|---|---|---|
| Total | 20.86 | 17.53 | 21.0% | 16.88 | 16.63 | 16.81 |
| Autos | 8.10 | 7.31 | 8.0% | 7.49 | 7.62 | 8.07 |
| Trucks | 12.76 | 10.22 | 31.1% | 9.39 | 9.01 | 8.74 |
by Tom Moeller August 3, 2005
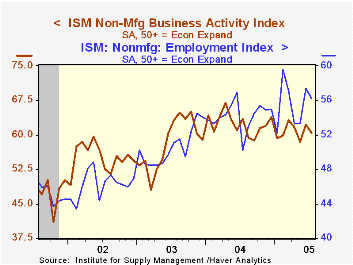
The July Business Activity Index for the non-manufacturing sector reversed about half of the prior month's improvement and fell 1.7 points to 60.5, reported the Institute for Supply Management. Consensus expectations had been for a decline to 61.
Since the series' inception in 1997 there has been a 50% correlation between the Business Activity Index and the q/q change in real GDP for services plus construction.
A employment index reversed just a piece of the June improvement and fell to a still firm 56.2. Since the series' inception in 1997 there has been a 60% correlation between the level of the ISM non-manufacturing employment index and the m/m change in payroll employment in the service producing plus the construction industries.
Moving the other way, the index of new orders jumped 2.4 points to 61.9, the highest level since March. Pricing power also surged. A 10.5 point gain m/m raised the index level to the highest level of this year (70.3).
ISM surveys more than 370 purchasing managers in more than 62 industries including construction, law firms, hospitals, government and retailers. The non-manufacturing survey dates only to July 1997, therefore its seasonal adjustment should be viewed tentatively.Business Activity Index for the non-manufacturing sector reflects a question separate from the subgroups mentioned above. In contrast, the NAPM manufacturing sector composite index is a weighted average five components.
| ISM Nonmanufacturing Survey | July | June | July '04 | 2004 | 2003 | 2002 |
|---|---|---|---|---|---|---|
| Business Activity Index | 60.5 | 62.2 | 63.4 | 62.4 | 58.2 | 55.1 |
| Prices Index | 70.3 | 59.8 | 72.4 | 69.0 | 56.8 | 54.0 |
by Tom Moeller August 3, 2005
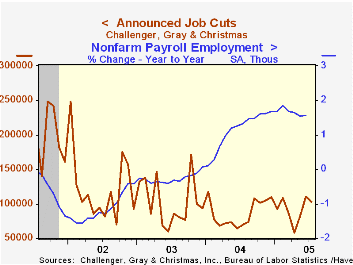
Challenger, Grey & Christmas reported that job cut announcements fell 7.2% in July to 102,971 but that followed sharp gains both in May (42.2%) and June (34.9%). The three month average of job cut announcements rose to the highest level (98,750) since February.
During the last ten years there has been an 84% (inverse) correlation between the three month moving average of announced job cuts and the three month change payroll employment.
Job cut announcements in the automotive industry fell sharply after increasing ten-fold in June. Job cuts also fell in the chemical and pharmaceutical industries but increases were quite strong in the financial, insurance, electronics and computer industries.
Job cut announcements differ from layoffs. Many are achieved through attrition, early retirement or just never occur.
Challenger also reported that announced hiring plans rose (1.1% y/y).
| Challenger, Gray & Christmas | July | June | Y/Y | 2004 | 2003 | 2002 |
|---|---|---|---|---|---|---|
| Announced Job Cuts | 102,971 | 110,996 | 48.0% | 1,039,175 | 1,236,426 | 1,431,052 |
by Tom Moeller August 3, 2005
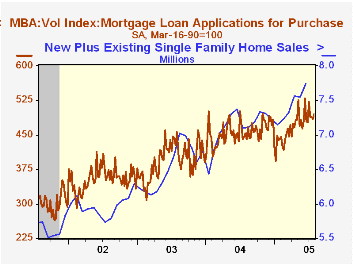
Total mortgage applications dipped 0.3% last week, the fifth decline in the last seven weeks according to the Mortgage Bankers Association. The decline lowered the average level in July 1.4% below June.
Again, the weekly decline was led by applications to refinance which fell 3.0% following a 11.4% drop the week prior. Applications to refinance are down 24.2% from the peak in early June.
Purchase applications went the other way last week with a 1.9% rise following three consecutive weeks of decline. The average level in July rose 0.9% versus June. During the last ten years there has been a 49% correlation between the y/y change in purchase applications and the change in new plus existing single family home sales.
The effective interest rate on a conventional 30-year mortgage rose to 6.06%, it's highest in three months. The effective rate on a 15-year mortgage also rose to 5.70%.
The Mortgage Bankers Association surveys between 20 to 35 of the top lenders in the U.S. housing industry to derive its refinance, purchase and market indexes. The weekly survey accounts for more than 40% of all applications processed each week by mortgage lenders. Visit the Mortgage Bankers Association site here.
| MBA Mortgage Applications (3/16/90=100) | 07/29/05 | 07/22/05 | Y/Y | 2004 | 2003 | 2002 |
|---|---|---|---|---|---|---|
| Total Market Index | 752.1 | 754.3 | 21.2% | 735.1 | 1,067.9 | 799.7 |
| Purchase | 494.5 | 485.1 | 9.4% | 454.5 | 395.1 | 354.7 |
| Refinancing | 2,250.3 | 2,320.3 | 40.6% | 2,366.8 | 4,981.8 | 3,388.0 |
by Carol Stone August 3, 2005
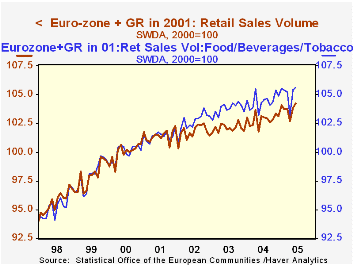
Retail sales in the Euro-Zone increased 0.4% in June, reported this morning by Eurostat, to reach 104.25 (2000=100), a record high. The previous high was 104.07 in January. As seen in the first chart, these sales are fairly erratic from month to month, even adjusted for seasonal and working-day variations. Thus, despite the June rise and a strong performance in May, the net gain over the last year is just 0.9%.
Sales of food, beverages and tobacco grew 0.2% in June and non-food products, 0.3%. Over the past few years, sales of food and related products have tended to be firmer than other categories. In part this may be associated with a shift in food marketing. Sales of food at specialized food stores have plummeted, while so-called "non-specialized stores" have seen consistent growth in their food sales. "One-stop shopping" seems popular -- at least for foods. Among non-food sales, pharmaceutical and medical goods and shopping by mail order have increased more than total sales in recent years. Interestingly, while food purchases have been strong at "non-specialized stores", nonfood items have declined.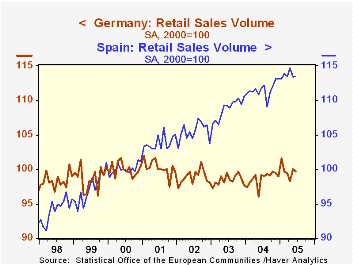
Among the various countries of the EU-12, strength has come from France, Finland, Ireland, Greece, Luxembourg, Portugal and Spain. Of these France and Luxembourg have flattened in recent months, but all are stronger than the group as a whole. The more sluggish performances have come in Germany, Austria, Belgium, Italy and the Netherlands; Austria and Belgium have recently seen some pick-up, however.
These sales do not include motor vehicle dealers and they are in volume terms, so gains are "real", not simply due to rising prices. While slow in an absolute sense -- up, as noted, less than 1% over the past year -- the gains are firmer than in the prior couple of years. We have had the preconception that the European economy is sluggish, but retail sales seem to suggest that activity there is at least holding its own, particularly in the consumer sector.
| Euro-Zone % Change, months seas adjusted |
June 2005 | May 2005 | Apr 2005 | Year- Ago | Year/Year|||
|---|---|---|---|---|---|---|---|
| 2004 | 2003 | 2002 | |||||
| Total | 0.4 | 1.1 | -1.0 | 0.9 | 0.8 | 0.3 | 0.3 |
| Food, Beverages, Tobacco | 0.2 | 2.2 | -1.9 | 1.2 | 0.7 | 1.1 | 1.2 |
| Non-Food Products | 0.3 | 0.5 | -0.5 | 0.4 | 0.7 | -0.4 | -0.4 |

Tom Moeller
AuthorMore in Author Profile »Prior to joining Haver Analytics in 2000, Mr. Moeller worked as the Economist at Chancellor Capital Management from 1985 to 1999. There, he developed comprehensive economic forecasts and interpreted economic data for equity and fixed income portfolio managers. Also at Chancellor, Mr. Moeller worked as an equity analyst and was responsible for researching and rating companies in the economically sensitive automobile and housing industries for investment in Chancellor’s equity portfolio. Prior to joining Chancellor, Mr. Moeller was an Economist at Citibank from 1979 to 1984. He also analyzed pricing behavior in the metals industry for the Council on Wage and Price Stability in Washington, D.C. In 1999, Mr. Moeller received the award for most accurate forecast from the Forecasters' Club of New York. From 1990 to 1992 he was President of the New York Association for Business Economists. Mr. Moeller earned an M.B.A. in Finance from Fordham University, where he graduated in 1987. He holds a Bachelor of Arts in Economics from George Washington University.
More Economy in Brief


