 Global| Jun 02 2006
EMPL Database Facilitates Labor Force Analysis; Example: Elderly Workers on the Rise
Summary
For the last several months, we have been working to expand and reorganize Haver's EMPL database, which consists of the BLS's massive collection of details on the Household Employment Survey. We've recoded the entire database, [...]
For the last several months, we have been working to expand and reorganize Haver's EMPL database, which consists of the BLS's massive collection of details on the Household Employment Survey. We've recoded the entire database, hopefully making the codes simpler, more intuitive and less like serial numbers. We've added about 1,700 new series, including more detail on employment of various resident Hispanic groups, such as Puerto Ricans. There is also greater detail now on educational status, a topic that receives much attention among the BLS data offerings. The database's menus in DLXVG3 are being restructured so they follow more closely the logic of the tables in Employment and Earnings. This "maintenance" has achieved much in facilitating the use of this enormous database -- now running toward 12,000 series -- and the work continues. Obviously, if you have suggestions, please offer them at data@haver.com.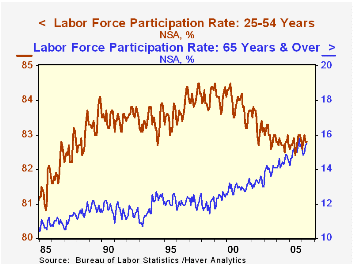
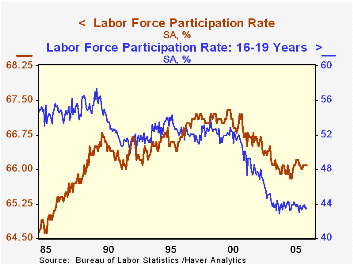
Meantime, we can address numerous questions and topics in the relationships of people to the labor market. We picked something at random to illustrate: labor force participation by age and race, with a highlight on older workers. The first graph shows that in recent years, total labor force participation has decreased somewhat: from 67% of the civilian noninstitutional population in the late 1990s to 66% in 2004 and 2005; it stood at 66.1% in
May, according to the latest data, reported this morning.This modest decline masks widely varying trends among age groups. Teen-agers (16-19 years old) participation has plunged, from 52% at the turn of the decade to just 43.5% last month. This rate has stabilized, however, creeping up from a low of 42.8% in March 2004. So a larger proportion of kids is once again starting to want to work. Other parts of EMPL will tell you how many of kids aged 16-24 are in school, whether they've graduated high school or are perhaps enrolled in college part-time. If they're unemployed, the data will tell you if how many are looking for full- or part-time work.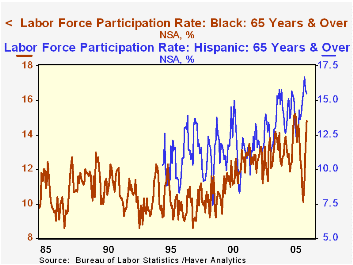
The opposite trend is seen in older workers. For people over age 65, labor force participation is rising; from an average of 12.2% of the population in 1995, the rate reached 15.5% in May. This is also seen in an almost parallel move among white workers in that age group. Other racial and ethnic groups have experienced even larger proportional increases. For blacks and Hispanics, this reflected lower participation in the mid-1990s, just around 10.5%. By now, that for Hispanics is as high as for whites, and blacks are not much below. Since 2000, the BLS has reported separate data for Asian workers. Their participation rates, at 13.7% for the 65 years & older age category, were above the rate for the total labor force in 2000, and while those rates are still relatively high, they also have been more erratic, so it is hard to draw strong conclusions about their labor force status. Nonetheless, an uptrend is clearly identifiable.
Older workers are thus increasingly "economically active", to apply the phrase used in several European countries. This could be simply because they are healthier than before. It could also be that basic living costs necessitate the earning of wage income. But there is one other policy factor that may be important. In April 2000, Congress and the President enacted a law repealing the earnings ceiling on social security benefits. Previously, a recipient's benefits were reduced $1 for every $3 they had in earnings above this ceiling, a clear disincentive to work in more than casual employment. Since then, however, there has been no such rule, and upturns in labor force participation can be marked to roughly the time of the law change. The increased participation even included the months of recession in 2001, a time when people usually pull back from job-hunting.
| % of Noninstitutional Population | May 2006 | Apr 2006 | 2005 | 2004 | 2003 | 2000 | 1995 |
|---|---|---|---|---|---|---|---|
| Total* | 66.1 | 66.1 | 66.0 | 66.0 | 66.2 | 67.1 | 66.6 |
| Age 16-19* | 43.5 | 43.4 | 43.7 | 43.8 | 44.5 | 52.0 | 53.5 |
| Age 25-54* | 82.8 | 82.8 | 82.8 | 82.8 | 83.0 | 84.0 | 83.5 |
| Age 65 & Over | 15.5 | 15.4 | 15.0 | 14.4 | 14.0 | 12.9 | 12.2 |
| White | 15.6 | 15.5 | 15.1 | 14.6 | 14.1 | 13.0 | 12.3 |
| Black | 14.8 | 13.1 | 13.6 | 13.1 | 12.9 | 11.6 | 10.5 |
| Asian | 16.3 | 20.4 | 15.5 | 13.1 | 13.7 | 13.7 | -- |
| Hispanic | 15.5 | 15.8 | 13.9 | 14.5 | 12.8 | 12.2 | 10.5 |
Carol Stone, CBE
AuthorMore in Author Profile »Carol Stone, CBE came to Haver Analytics in 2003 following more than 35 years as a financial market economist at major Wall Street financial institutions, most especially Merrill Lynch and Nomura Securities. She had broad experience in analysis and forecasting of flow-of-funds accounts, the federal budget and Federal Reserve operations. At Nomura Securities, among other duties, she developed various indicator forecasting tools and edited a daily global publication produced in London and New York for readers in Tokyo. At Haver Analytics, Carol was a member of the Research Department, aiding database managers with research and documentation efforts, as well as posting commentary on select economic reports. In addition, she conducted Ways-of-the-World, a blog on economic issues for an Episcopal-Church-affiliated website, The Geranium Farm. During her career, Carol served as an officer of the Money Marketeers and the Downtown Economists Club. She had a PhD from NYU's Stern School of Business. She lived in Brooklyn, New York, and had a weekend home on Long Island.
More Economy in Brief


