 Global| Nov 15 2006
Empire State Index Unexpectedly Firm
by:Tom Moeller
|in:Economy in Brief
Summary
The November index of manufacturing activity in New York State firmed again. The Index of General Business Conditions rose 3.74 points to 26.66 on top of the nearly twelve point advance during the prior two months. Consensus [...]
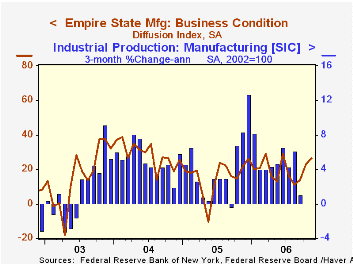
The November index of manufacturing activity in New York State firmed again. The Index of General Business Conditions rose 3.74 points to 26.66 on top of the nearly twelve point advance during the prior two months. Consensus expectations for the Empire State index had been for a decline to 15.0. The figures are reported by the Federal Reserve Bank of New York.
Since the series' inception in 2001 there has been a 75% correlation between the index level and the three month change in U.S. factory sector industrial production.
The indexes for new orders, employment and shipments led the m/m improvement. Each of the other component series rose as well with the exception of work hours which fell for the second month.
Like the Philadelphia Fed Index of General Business Conditions, the Empire State Business Conditions Index reflects answers to an independent survey question; it is not a weighted combination of the components.
Pricing pressure also improved moderately. The 4.07 rise in the prices paid index came after a ten point decline during October. Since 2001 there has been an 88% correlation between the index of prices paid and the three month change in the core intermediate materials PPI.
The Empire State index of expected business conditions in six months made up for all of the weakness in recent months with a 7.59 point rise.
The Empire State Manufacturing Survey is a monthly survey of manufacturers in New York State conducted by the Federal Reserve Bank of New York. Participants from across the state in a variety of industries respond to a questionnaire and report the change in a variety of indicators from the previous month. Respondents also state the likely direction of these same indicators six months ahead. April 2002 is the first report, although survey data date back to July 2001.
For more on the Empire State Manufacturing Survey, including methodologies and the latest report, click here.
What Are the Risks to the United States of a Current Account Reversal? from the Federal Reserve Bank of San Francisco can be found here
| Empire State Manufacturing Survey | November | October | Nov. '05 | 2005 | 2004 | 2003 |
|---|---|---|---|---|---|---|
| General Business Conditions (diffusion index) | 26.66 | 22.92 | 21.88 | 15.56 | 28.79 | 15.98 |
by Tom Moeller November 15, 2006
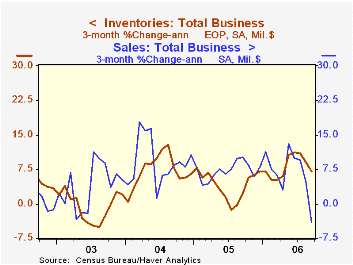
Total business inventories rose just 0.4% in September following an unrevised 0.6% rise during August. Consensus expectations had been for a 0.5% increase but together the increases during the last three months which averaged 0.6% were the slowest since April and the one month gain was the slowest since February.
During the last ten years there has been a 57% correlation between the y/y change in business inventories and the change in factory sector industrial production. Using quarterly figures, there has been an 84% correlation between the change in real private nonfarm inventories and production.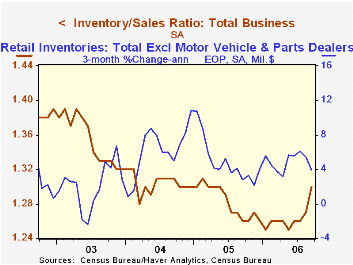
Business sales fell 2.0% (+4.9% y/y) due to the 3.5% m/m slide in factory shipments. In addition, retail sales fell 0.8% (+5.2% y/y) and wholesale sales fell 1.2% (+8.1% y/y). As a result the inventory to sales ratio surged to 1.30, the highest since March 2003.
Retail inventories fell 0.1% but excluding autos they rose 0.1%. That latter gain compared to monthly increases between 0.2% and 0.7% since March. General merchandise inventories increased 0.3% (0.9% y/y) after a 0.7% gain but accumulation of clothing store inventories accelerated to 0.7% (6.2% y/y). Furniture inventories rose 0.2% (4.9% y/y) after a 0.3% August decline.
Production and Inventory Behavior of Capital from the Federal Reserve Bank of St. Louis is available here.
| Business Inventories | September | August | Y/Y | 2005 | 2004 | 2003 |
|---|---|---|---|---|---|---|
| Total | 0.4% | 0.6% | 7.6% | 4.4% | 7.6% | -1.0% |
| Retail | -0.1% | 0.3% | 6.1% | 2.7% | 6.7% | 3.8% |
| Retail excl. Autos | 0.1% | 0.6% | 4.3% | 4.5% | 7.1% | 1.9% |
| Wholesale | 0.8% | 1.2% | 9.9% | 7.1% | 9.8% | 1.8% |
| Manufacturing | 0.6% | 0.6% | 7.4% | 4.0% | 6.9% | -7.4% |
by Tom Moeller November 15, 2006
The total number of mortgage applications surged another 4.3% last week on the heels of the 8.8% recovery at the beginning of November, according to the Mortgage Bankers Association. The gains lifted total applications this month 8.2% above the October average which fell 0.6% from September.
Applications to refinance increased 6.5% after the prior week's 11.0% jump to the highest level in over one year and are up 10.2% from the October average which rose 3.5% from September.
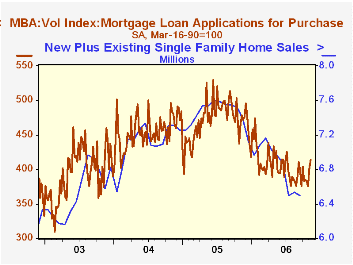
Purchase applications also rose a firm 2.7% after the prior week's 7.1% lift. The increase to the highest level since July raised November purchase applications 6.8% ahead of the October average level. Purchase applications fell 3.6% last month from September on average.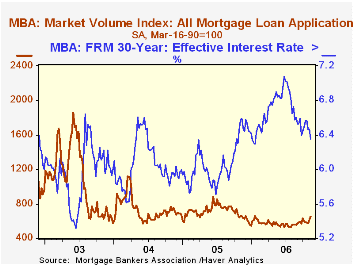
During the last ten years there has been a 58% correlation between the y/y change in purchase applications and the change in new plus existing single family home sales.
The effective interest rate on a conventional 30-year mortgage fell eleven basis points w/w to 6.35% and was down from a high last month of 6.57%. The peak for 30 year financing was 7.08% late in June. The rate for 15-year financing fell ten points to 6.10%. The peak for 15 year financing was 6.75% during June. Interest rates on 15 and 30 year mortgages are closely correlated (>90%) with the rate on 10 year Treasury securities.
During the last ten years there has been a (negative) 79% correlation between the level of applications for purchase and the effective interest rate on a 30-year mortgage.
The Mortgage Bankers Association surveys between 20 to 35 of the top lenders in the U.S. housing industry to derive its refinance, purchase and market indexes. The weekly survey accounts for more than 40% of all applications processed each week by mortgage lenders. Visit the Mortgage Bankers Association site here.
U.S. Labor Input in Coming Years is yesterday's speech by St. Louis Fed President William Poole and it is available here.
| MBA Mortgage Applications (3/16/90=100) | 11/10/06 | 11/03/06 | Y/Y | 2005 | 2004 | 2003 |
|---|---|---|---|---|---|---|
| Total Market Index | 647.5 | 620.9 | -1.5% | 708.6 | 735.1 | 1,067.9 |
| Purchase | 412.9 | 402.2 | -13.6% | 470.9 | 454.5 | 395.1 |
| Refinancing | 2,022.2 | 1,897.9 | 18.8% | 2,092.3 | 2,366.8 | 4,981.8 |
by Carol Stone November 15, 2006
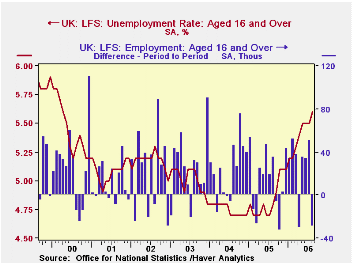
Employment in the UK fell 29,000 in the August period, reversing more than half of July's 51,000 increase. This move accompanied a 0.1% uptick in the unemployment rate to 5.6% from 5.5%. Both figures are three-month centered moving averages, so they cover July, August and September. Compared with three months before, the style of comparison that the UK's Office of National Statistics (ONS) generally emphasizes, the August number was up 56,000 from May, which in turn had been up 43,000 from February. So their longer horizon still highlights gains in the late spring/early summer.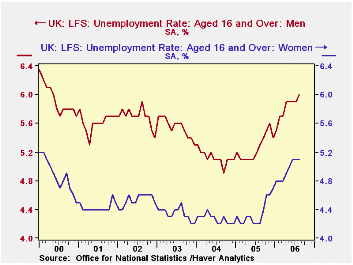
By demographic category, employment among men continued to increase modestly, while women's employment fell 39,000 from the July period to August. Interestingly, the increase in the unemployment rate occurred among men, from 5.9% to 6.0%, while the rate for women remained steady at 5.1%. A sizable rise in the number of women deciding to leave the labor force -- becoming "economically inactive" in the ONS terminology -- to maintain their homes kept their unemployment rate from going up. Even so, the overall 5.6% unemployment rate is the highest since the April period in 2000.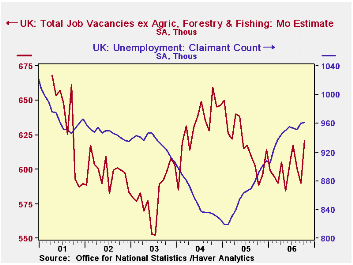
Another sign of softness in the UK labor situation came in the average earnings index, or AEI. This is an index of average earnings over the last three months relative to the same period a year ago. It slowed to 3.9% in the latest three-month period from 4.2% the period before. This effectively closed off a firming trend that had been running since February. This measure is seen in the UK as a major determinant of inflation pressure, and it is watched closely by financial markets and the Bank of England. Indeed, press reports highlighted the slowdown this morning. Additionally, the so-called claimant count rose in the month of October, reaching 961,300, up almost 10,000 from just two months ago and 70,000 from a year ago (7.9%). Two months ago here, we took note of politicians' pleasure in a "welcome fall" in claimants for unemployment benefits, but the mild reduction back in the summer has been more than counterbalanced. In contrast, a more favorable labor market development is a gain of 30,000 in the number of reported job vacancies, which reached 620,600, the highest in 17 months.
| UK Labor Force Survey & Related Labor Data | Oct 2006 | Sept 2006 | Aug 2006 | July 2006 | Year Ago | 2005 | 2004 | 2003 |
|---|---|---|---|---|---|---|---|---|
| Employment (3Mo Avg, SA, Thous) |
-- | -- | 28,986 | 29,015 | 28,794 | 28,730 | 28,465 | 28,183 |
| Chg from 1 & 3 Months Ago | -- | -- | -29/56 | 51/120 | +16(MoAvg) | 0.9% | 1.0% | 1.0% |
| Unemployment Rate (3Mo Avg, SA, %) |
-- | -- | 5.6% | 5.5% | 4.8% | 4.8% | 4.8% | 5.0% |
| Claimant Count (Monthly, Thous) |
963.1 | 960.1 | 951.8 | 954.0 | 891.2 | 874.4 | 866.1 | 945.9 |
| Vacancies (Monthly, Thous) | 620.6 | 590.0 | 600.7 | 617.6 | 588.4 | 619.0 | 631.9 | 582.0 |
| Average Earnings Index inc Bonus (Headline Rate*) | -- | 3.9% | 4.2% | 4.4% | 4.2% | 4.0% | 4.5% | 3.4% |

Tom Moeller
AuthorMore in Author Profile »Prior to joining Haver Analytics in 2000, Mr. Moeller worked as the Economist at Chancellor Capital Management from 1985 to 1999. There, he developed comprehensive economic forecasts and interpreted economic data for equity and fixed income portfolio managers. Also at Chancellor, Mr. Moeller worked as an equity analyst and was responsible for researching and rating companies in the economically sensitive automobile and housing industries for investment in Chancellor’s equity portfolio. Prior to joining Chancellor, Mr. Moeller was an Economist at Citibank from 1979 to 1984. He also analyzed pricing behavior in the metals industry for the Council on Wage and Price Stability in Washington, D.C. In 1999, Mr. Moeller received the award for most accurate forecast from the Forecasters' Club of New York. From 1990 to 1992 he was President of the New York Association for Business Economists. Mr. Moeller earned an M.B.A. in Finance from Fordham University, where he graduated in 1987. He holds a Bachelor of Arts in Economics from George Washington University.


