 Global| Jun 19 2006
Empire State Index Recovered in June
by:Tom Moeller
|in:Economy in Brief
Summary
The June Empire State Mfg. Index of General Business Conditions, reported by the Federal Reserve Bank of New York, surged 16.07 points to 29.01 and recovered all of the declines during the prior two months. Consensus expectations had [...]
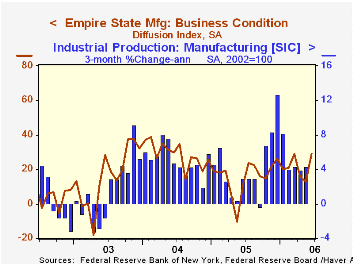
The June Empire State Mfg. Index of General Business Conditions, reported by the Federal Reserve Bank of New York, surged 16.07 points to 29.01 and recovered all of the declines during the prior two months. Consensus expectations had been for a slight m/m decline to 11.0.
Since the series' inception in 2001 there has been a 75% correlation between the index level and the three month change in U.S. factory sector industrial production.
New orders & shipments both surged to near the series' recent highs while the index indicating the number of employees slipped to its lowest level of the year.
Pricing pressure rose to a level near the year's high. Since 2001 there has been an 88% correlation between the index of prices paid and the three month change in the core intermediate materials PPI.
Like the Philadelphia Fed Index of General Business Conditions, the Empire State Business Conditions Index reflects answers to an independent survey question; it is not a weighted combination of the components.
The Empire State index of expectations for business conditions in six months for June recovered just a piece of the prior month's sharp decline as expected new orders fell and pricing pressure surged to the highest level of this year.
The Empire State Manufacturing Survey is a monthly survey of manufacturers in New York State conducted by the Federal Reserve Bank of New York. Participants from across the state in a variety of industries respond to a questionnaire and report the change in a variety of indicators from the previous month. Respondents also state the likely direction of these same indicators six months ahead. April 2002 is the first report, although survey data date back to July 2001. 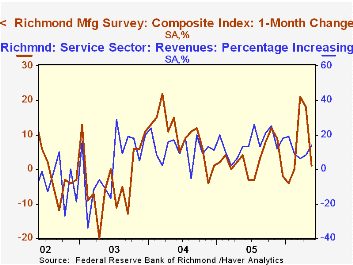
For more on the Empire State Manufacturing Survey, including methodologies and the latest report, click here.
The rise in the Empire State Manufacturing index ran somewhat counter to the decline in Philadelphia Fed's index reported Friday. The Federal Reserve Bank of Richmond will report its June Mfg. Survey index later this week. The reading will follow a sharp fall-off in the May figure, notably for orders, shipments and jobs The data will be available in the Haver SURVEYS database.
During the last ten years there has been a 39% correlation between the Richmond survey index level and the one month change in U.S. factory sector industrial production. The latest Richmond Fed Mfg. Survey is available here.
The Richmond Fed also publishes indexes of conditions in the Service Sector and the latest release is available here.
| Empire State Manufacturing Survey | June | May | June '05 | 2005 | 2004 | 2003 |
|---|---|---|---|---|---|---|
| General Business Conditions (diffusion index) | 29.01 | 12.94 | 10.18 | 15.56 | 28.79 | 15.98 |
by Louise Curley June 19, 2006
The Euro Zone reported a deficit for April of 870 million euros in its trade in goods with the rest of the world. This was more than double the March figure of 350 million euros, and was in sharp contrast to the surplus of 3,167 million euros of April, 2005.
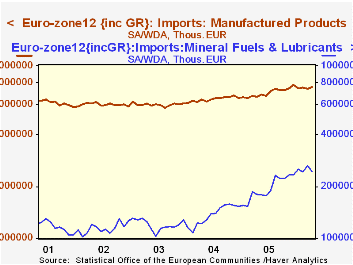
The deterioration in the Euro Zone's trade balance over the past year is largely the result of the increasing cost of fuel imports. The import category--mineral fuels and lubricants--is compared with the import category of manufactured products in the first chart. The data are plotted on a log scale so that the rates of change in the two series can be compared. It is apparent that imports of petroleum products have been rising at a much faster rate than those of manufactured products.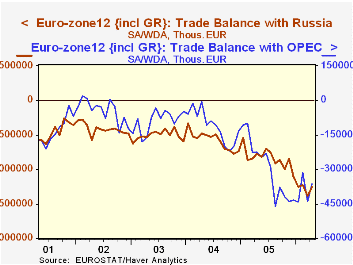
The impact of rising oil prices is also reflected in the Euro Zone's trade balances with Russia and with OPEC, as can be seen in the second chart. The deterioration in trade with Russia from April of last year to April of this year was 1,408.2 million euros and that in trade with OPEC was 1,379.5 million euros. Together these two deficits accounted for about two thirds of the total deficit of 4,036.6 million euros.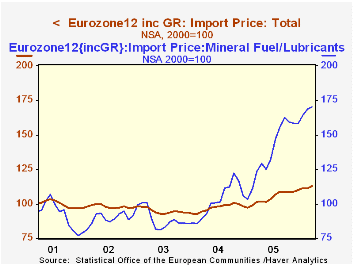
The final chart compares the prices of mineral fuels, lubricants and related products with the prices of all imports. Once again the data have been presented on a log scale to facilitate the comparison of rates of change. Over the past year, the prices of mineral fuels, lubricants and related product have risen 35.8% or more than three times as fast as the prices of all imports.
| Euro Zone Trade in Goods (SA & WDA--Million Euros) |
April 06 | April 05 | Y/Y Difference |
|---|---|---|---|
| Exports | 113,735.5 | 99,919.8 | 17,872.4 |
| Imports | 114,625.4 | 96,753.0 | 13,835.7 |
| Balance | -869.9 | 3,166.8 | -4,036.6 |
| Balance of Mineral Fuels and Lubricants | -20,037.5 | -15,215.7 | -4,821.8 |
| Balance on Manufactured Products | 20,843.1 | 19,328.9 | 1,514.2 |
| Balance with Russia | -3,747.6 | -2,339.4 | -1,408.2 |
| Import Price of Mineral Fuels, Lubricants and related Products (2000=100) |
125.10 | 101.2 | 11.6* |
| Import Price of Total Imports | 169.90 | 125.10 | 35.8* |

Tom Moeller
AuthorMore in Author Profile »Prior to joining Haver Analytics in 2000, Mr. Moeller worked as the Economist at Chancellor Capital Management from 1985 to 1999. There, he developed comprehensive economic forecasts and interpreted economic data for equity and fixed income portfolio managers. Also at Chancellor, Mr. Moeller worked as an equity analyst and was responsible for researching and rating companies in the economically sensitive automobile and housing industries for investment in Chancellor’s equity portfolio. Prior to joining Chancellor, Mr. Moeller was an Economist at Citibank from 1979 to 1984. He also analyzed pricing behavior in the metals industry for the Council on Wage and Price Stability in Washington, D.C. In 1999, Mr. Moeller received the award for most accurate forecast from the Forecasters' Club of New York. From 1990 to 1992 he was President of the New York Association for Business Economists. Mr. Moeller earned an M.B.A. in Finance from Fordham University, where he graduated in 1987. He holds a Bachelor of Arts in Economics from George Washington University.
More Economy in Brief


