 Global| Jan 18 2005
Empire State Index Eased
by:Tom Moeller
|in:Economy in Brief
Summary
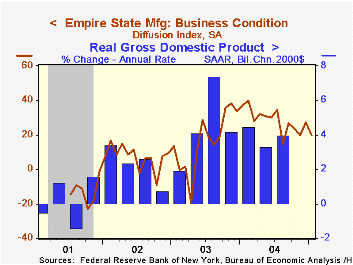
The Empire State Index of General Business Conditions in New York's manufacturing industries fell seven points to 20.08 during January following revisions that lowered earlier months' levels. The latest level at 20.08 nevertheless [...]

The Empire State Index of General Business Conditions in New York's manufacturing industries fell seven points to 20.08 during January following revisions that lowered earlier months' levels. The latest level at 20.08 nevertheless indicates continued positive economic growth.
The new orders component eased sharply from the near record level in December and shipments eased sharply as well. The employment measure fell a relatively moderate three points. Like the Philadelphia Fed Index of General Business Conditions, the Empire State Business Conditions Index reflects answers to an independent survey question; it is not a weighted combination of the components.
The prices paid index surged more than twelve points to a record high.
Expectations for business conditions in six months again fell for the fourth consecutive month to the lowest level since March 2003.
The Empire State Manufacturing Survey is a monthly survey of manufacturers in New York State conducted by the Federal Reserve Bank of New York. Participants from across the state in a variety of industries respond to a questionnaire and report the change in a variety of indicators from the previous month. Respondents also state the likely direction of these same indicators six months ahead. April 2002 is the first report, although survey data date back to July 2001.
For more on the Empire State Manufacturing Survey, including methodologies and the latest report, click here.
| Empire State Manufacturing Survey | Jan | Dec | Jan '04 | 2004 | 2003 | 2002 |
|---|---|---|---|---|---|---|
| General Business Conditions (diffusion index) | 20.08 | 27.07 | 37.43 | 28.76 | 16.17 | 7.19 |
by Tom Moeller January 18, 2005

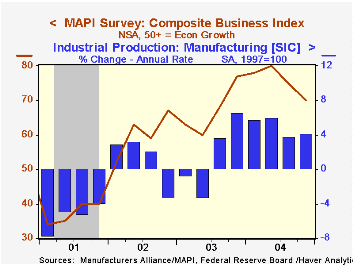
The 4Q'04 Composite Business Index published by the Manufacturers' Alliance/MAPI fell to 70 from 75 the prior quarter. Despite moderate declines both last quarter and in 3Q, the average level for 2004 set a series' record indicating sharp improvement in US factory sector output.
Since 1992 there has been a 68% correlation between the Composite Index Level and quarterly growth in factory sector output.
The current orders index fell modestly to 89 but the average of 91 for 2004 by far set a record. The export orders index for 4Q moved to a new record.
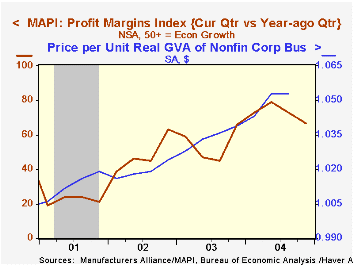
The profit margins index likewise moved lower but the annual level in 2004 set a new record.Capital spending intentions for the coming year moved higher and since 1992 there has been a 75% correlation between the capital spending index a y/y growth in business investment in equipment & software.
For the latest press release from the MAPI click here.
| Manufacturers' Alliance/MAPI Survey | 4Q '04 | 3Q '04 | 4Q03 | 2004 | 2003 | 2002 |
|---|---|---|---|---|---|---|
| Composite Business Index | 70 | 75 | 77 | 76 | 67 | 60 |
by Tom Moeller January 18, 2005

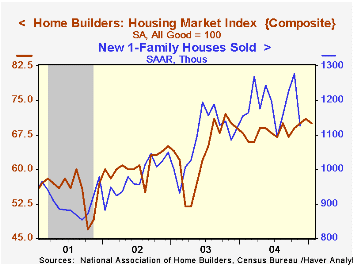
The National Association of Home Builders' (NAHB) Composite Housing Market Index fell slightly in January to 70 versus December's level of 71. Through 2004 the index drifted higher from 67 in 1Q to 69 in 2Q to 68 in 3Q to 70 in 4Q. The average of 68 rose 7.3% from 2003.
During the last twenty years, annual changes in the composite index had an 83% correlation with the change in new home sales. There's been an 86% correlation with the change in single family housing starts.
The NAHB index is a diffusion index based on a survey of builders. Readings above 50 signal that more builders view conditions as good than poor.
Each of the components of the composite fell in January with the largest declines logged in home builders' read of prospective activity in six months and in traffic of prospective buyers of new homes.
Visit the National Association of Home Builders using this link.
Philadelphia Federal Reserve Bank President Anthony M Santomero's speech today on the economic outlook is available here.
| Nat'l Association of Home Builders | Jan | Dec | Jan '04 | 2004 | 2003 | 2002 |
|---|---|---|---|---|---|---|
| Composite Housing Market Index | 7 0 | 71 | 68 | 68 | 64 | 61 |
Tom Moeller
AuthorMore in Author Profile »Prior to joining Haver Analytics in 2000, Mr. Moeller worked as the Economist at Chancellor Capital Management from 1985 to 1999. There, he developed comprehensive economic forecasts and interpreted economic data for equity and fixed income portfolio managers. Also at Chancellor, Mr. Moeller worked as an equity analyst and was responsible for researching and rating companies in the economically sensitive automobile and housing industries for investment in Chancellor’s equity portfolio. Prior to joining Chancellor, Mr. Moeller was an Economist at Citibank from 1979 to 1984. He also analyzed pricing behavior in the metals industry for the Council on Wage and Price Stability in Washington, D.C. In 1999, Mr. Moeller received the award for most accurate forecast from the Forecasters' Club of New York. From 1990 to 1992 he was President of the New York Association for Business Economists. Mr. Moeller earned an M.B.A. in Finance from Fordham University, where he graduated in 1987. He holds a Bachelor of Arts in Economics from George Washington University.
More Economy in Brief
 Global| Feb 05 2026
Charts of the Week: Balanced Policy, Resilient Data and AI Narratives
by:Andrew Cates


