 Global| Feb 16 2010
Empire State Factory ConditionsImprove; Inventories End Decumulation
by:Tom Moeller
|in:Economy in Brief
Summary
Business conditions in the Northeast improved this month. The Federal Reserve Bank of New York reported that its February Empire State Factory Index of General Business Conditions rose to 24.91, the highest level since October, and [...]
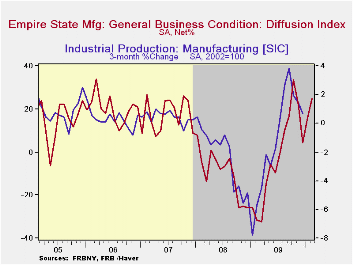 Business
conditions in the Northeast improved this month.
The Federal Reserve Bank of New York reported that its February Empire
State Factory Index of General Business Conditions rose to 24.91, the
highest level since October, and remained near the highest level since
2004. The latest reading compares to sharply negative levels at the
recession low and suggests positive growth in factory sector activity.
The latest level exceeded Consensus expectations for a reading of
18.0.
Business
conditions in the Northeast improved this month.
The Federal Reserve Bank of New York reported that its February Empire
State Factory Index of General Business Conditions rose to 24.91, the
highest level since October, and remained near the highest level since
2004. The latest reading compares to sharply negative levels at the
recession low and suggests positive growth in factory sector activity.
The latest level exceeded Consensus expectations for a reading of
18.0.
The figure is a diffusion index. Since the series' inception in 2001, there has been a 74% correlation between its level and the three-month change in U.S. factory sector industrial production. Like the Philadelphia Fed Index of General Business Conditions, the Empire State Business Conditions Index reflects answers to independent survey questions; it is not a weighted combination of the components. The series dates back only to 2001.
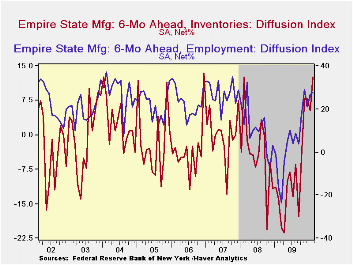
Amongst the separate survey questions, the inventory series improved the most this month to 0.0 from -17.3, which was the first reading out of negative territory since August 2008. Most other series fell m/m except employment which improved to its highest level since October. There has been an 87% correlation between the employment index and the three-month growth in factory sector employment as reported by the Labor Department.
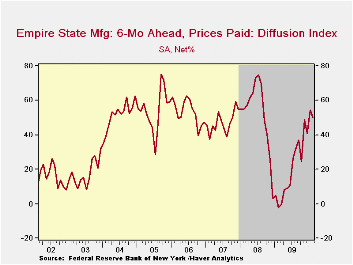
The prices paid index held near the highest level since September 2008 and was up sharply from the early-2009 low. Since inception in 2001, there has been a 77% correlation between the index of prices paid and the three-month change in the core intermediate materials PPI.
The Empire State index of expected business conditions in six months slipped during February from levels which were the highest since early 2004. The inventory subseries rose sharply to its highest since early 2008.
The Empire State Manufacturing Survey is a monthly survey of manufacturers in New York State. Participants from across the state in a variety of industries respond to a questionnaire and report the change in indicators from the previous month. Each index is seasonally adjusted. Respondents also state the likely direction of these same indicators six months ahead. For more on the Empire State Manufacturing Survey, including methodologies and the latest report, click here. The Empire State data is available in Haver's SURVEYS database.
Equipping financial regulators with the tools necessary to monitor systemic risk is last Friday's Senate testimony by Fed Governor Governor Daniel K. Tarullo and it is available here.
| Empire State Manufacturing Survey | February | January | December | February '09 | 2009 | 2008 | 2007 |
|---|---|---|---|---|---|---|---|
| General Business Conditions (diffusion index, %) | 24.91 | 15.92 | 4.5 | -31.61 | -2.76 | -9.97 | 17.22 |
| New Orders | 8.78 | 20.48 | 2.77 | -27.20 | -2.52 | -6.22 | 15.70 |
| Inventories | 0.00 | -17.33 | -18.42 | -8.05 | -22.89 | -7.87 | -3.95 |
| Employment | 5.56 | 4.00 | -5.26 | -39.08 | -17.28 | -5.36 | 11.28 |
| Prices Paid | 31.94 | 32.00 | 19.74 | -13.79 | 1.33 | 46.99 | 35.64 |
by Louise Curley February 16, 2010
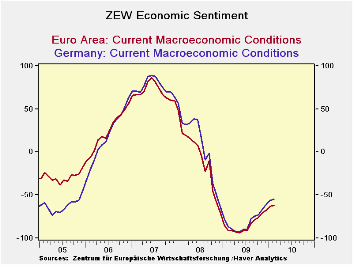 The financial community in Germany has become less enthusiastic about
economic prospects in Germany and in the Euro Area as a whole. The
results of the latest ZEW survey of analysts and institutional
investors showed that the balance of those looking for improved
conditions six months ahead in Germany over those looking for
deteriorating conditions was 45.4% in February, down 1.8 points from
47.2% in January and down 12.6 points from the peak, 57.7%, in
September of last year. Although the majority of the participants still
view current conditions negatively, the excess of pessimists over
optimists declined slightly from 56.6% to 54.8%.
The financial community in Germany has become less enthusiastic about
economic prospects in Germany and in the Euro Area as a whole. The
results of the latest ZEW survey of analysts and institutional
investors showed that the balance of those looking for improved
conditions six months ahead in Germany over those looking for
deteriorating conditions was 45.4% in February, down 1.8 points from
47.2% in January and down 12.6 points from the peak, 57.7%, in
September of last year. Although the majority of the participants still
view current conditions negatively, the excess of pessimists over
optimists declined slightly from 56.6% to 54.8%.
 The
participants in the latest survey are generally less optimistic about
profit prospects. Among the thirteen industries covered, only
construction and services showed an increased balance of optimists over
pessimists. The negative balances of opinion on the outlook for profits
in the automobile and the retail/consumer goods industries increased in
February. The balance on the profit outlook for the automobile industry
was -29.7% in February compared with -23.2% in January. The comparable
figures for the consumption/trade industries were-18.9% and -12.1%. The
balances of opinion on the out look for profits in the remaining
industries are still positive after declines in February. The balances
of opinion for the thirteen industries in February and their changes
from January are shown in the table below.
The
participants in the latest survey are generally less optimistic about
profit prospects. Among the thirteen industries covered, only
construction and services showed an increased balance of optimists over
pessimists. The negative balances of opinion on the outlook for profits
in the automobile and the retail/consumer goods industries increased in
February. The balance on the profit outlook for the automobile industry
was -29.7% in February compared with -23.2% in January. The comparable
figures for the consumption/trade industries were-18.9% and -12.1%. The
balances of opinion on the out look for profits in the remaining
industries are still positive after declines in February. The balances
of opinion for the thirteen industries in February and their changes
from January are shown in the table below.
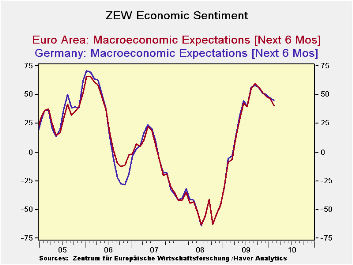
In addition to an appraisal of current economic conditions and expectations of conditions six months ahead for Germany, the participants in the ZEW survey also provide a similar appraisal for the Euro Area. The balance of those expecting an improvement in the economy of the entire Euro Area was 40.2% in February, 4.9 points lower than that for Germany and the balance on current conditions was -62.7%, 6.1 points more unfavorable than the -56.6% for Germany. The two attached charts compare the balances of opinion on (1) current conditions and (2) expectations for Germany and for the Euro Area. No doubt the severity of the financial crisis in Greece together with continued concern over the economies of Ireland, Portugal and Spain account for the more cautious appraisal of prospects for the entire Euro Area than that for Germany.
| ZEW INDICATORS (% Balance) | Feb 10 | Jan 10 | Peak | M/M Chg | Chg from Peak | Industry | Feb 10 | M/M Chg |
|---|---|---|---|---|---|---|---|---|
| Germany | Banks | 15.8 | -6.8 | |||||
| Current Conditions | -54.8 | -56.6 | -92.8** | 1.8 | 38.0 | Insurance | 11.0 | -5.6 |
| Expectations | 45.1 | 47.2 | 57.7* | -1.9 | -12.6 | Automobile | -29.7 | -6.5 |
| Chem/Pharma | 35.8 | -4.9 | ||||||
| Euro Area | Steel | 23.8 | -5.5 | |||||
| Current Conditions | -62.1 | -62.7 | -93.2** | 1.6 | 31.1 | Electronics | 22.0 | -5.0 |
| Expectations | 40.2 | 46.2 | 59.6* | -6.0 | -19.4 | Mech. Eng | 29.6 | -4.2 |
| Retail/ Cons | -18.9 | -6.8 | ||||||
| Construction | 4.2 | +3.8 | ||||||
| Utilities | 21.4 | -0.6 | ||||||
| Services | 22.1 | +1.0 | ||||||
| Telecom | 6.4 | -3.1 | ||||||
| * September 2009 ** May 2009 | Info Tech | 33.5 | -2.9 | |||||
by Tom Moeller February 16, 2010
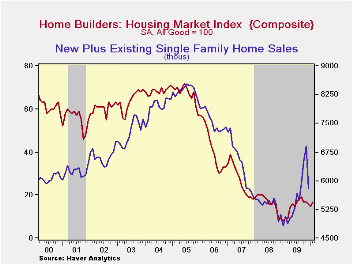 Low
interest rates and improved affordability have yet to generate strong
improvement in the housing market. The National Association of Home
Builders' index of housing market activity improved this month to 17
from 15 in January, but that was only back to the 4Q average.
Nevertheless, the index remained double the low of 8 hit last January.
The index is compiled from survey questions asking builders to rate
market conditions as “good”, “fair”, “poor” or “very high” to “very
low”. The figure is thus a diffusion index
with numerical results over 50 indicating a predominance of “good”
readings.
Low
interest rates and improved affordability have yet to generate strong
improvement in the housing market. The National Association of Home
Builders' index of housing market activity improved this month to 17
from 15 in January, but that was only back to the 4Q average.
Nevertheless, the index remained double the low of 8 hit last January.
The index is compiled from survey questions asking builders to rate
market conditions as “good”, “fair”, “poor” or “very high” to “very
low”. The figure is thus a diffusion index
with numerical results over 50 indicating a predominance of “good”
readings.
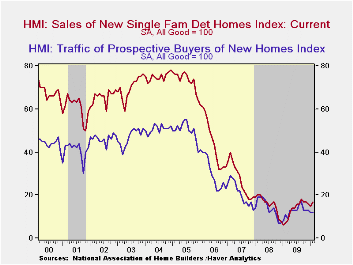
The present sales index improved m/m to 17 and equaled the 4Q and 3Q averages. The sub-index of sales during the next six months also improved modestly versus January. The Home Builders' Association also reported that the traffic of prospective buyers languished at a reading of 12 which was below the averages from 2Q to 4Q of last year.
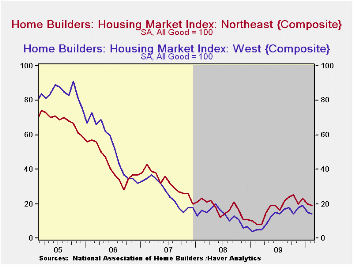
The regional housing market indexes showed improvement versus last year throughout the country but there has been modest backpedaling in the Northeast & the Midwest and relative stability in the South & the West.
The Home Builders' Housing Opportunity Index, which is the share of homes sold that could be considered affordable to a family earning the median income, fell in 3Q '09 (the latest available figure) to 70.1%. It had jumped earlier to a record high of 72.5% buoyed by lower home prices, lower interest rates and higher income. (There is a break in the series from 2002 to 2003.).
The NAHB has compiled the Housing Market Index since 1985. The weights assigned to the individual index components are .5920 for single family detached sales, present time; .1358 for single family detached sales, next six months; and .2722 for traffic of prospective buyers. The results, along with other housing and remodeling indexes from NAHB Economics, are included in Haver’s SURVEYS database.
IMF Explores Contours of Future Macroeconomic Policy from the International Monetary Fund can be found here.
| Nat'l Association of Home Builders | February | January | December | February '09 | 2009 | 2008 | 2007 |
|---|---|---|---|---|---|---|---|
| Composite Housing Market Index (All Good=100) | 17 | 15 | 16 | 9 | 15 | 16 | 27 |
| Single-Family Sales | 17 | 15 | 16 | 7 | 13 | 16 | 27 |
| Single-Family Sales: Next Six Months | 27 | 26 | 26 | 15 | 24 | 25 | 37 |
| Traffic of Prospective Buyers | 12 | 12 | 13 | 11 | 13 | 14 | 21 |

Tom Moeller
AuthorMore in Author Profile »Prior to joining Haver Analytics in 2000, Mr. Moeller worked as the Economist at Chancellor Capital Management from 1985 to 1999. There, he developed comprehensive economic forecasts and interpreted economic data for equity and fixed income portfolio managers. Also at Chancellor, Mr. Moeller worked as an equity analyst and was responsible for researching and rating companies in the economically sensitive automobile and housing industries for investment in Chancellor’s equity portfolio. Prior to joining Chancellor, Mr. Moeller was an Economist at Citibank from 1979 to 1984. He also analyzed pricing behavior in the metals industry for the Council on Wage and Price Stability in Washington, D.C. In 1999, Mr. Moeller received the award for most accurate forecast from the Forecasters' Club of New York. From 1990 to 1992 he was President of the New York Association for Business Economists. Mr. Moeller earned an M.B.A. in Finance from Fordham University, where he graduated in 1987. He holds a Bachelor of Arts in Economics from George Washington University.
More Economy in Brief


