 Global| May 17 2010
Empire State Business ConditionsDeteriorate Except Jobs & Pricing
by:Tom Moeller
|in:Economy in Brief
Summary
Recent improvement in business conditions in the Northeast region of the country lost momentum this month. The Federal Reserve Bank of New York reported that its May Empire State Factory Index of General Business Conditions fell to [...]
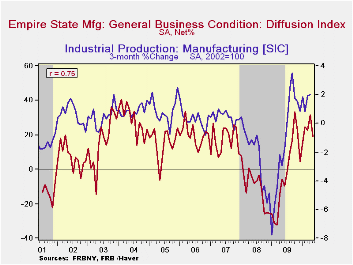
Recent improvement in business conditions in the Northeast region of the country lost momentum this month. The Federal Reserve Bank of New York reported that its May Empire State Factory Index of General Business Conditions fell to 19.11, its lowest level this year. Nevertheless, the May level suggests positive growth in factory sector activity but it fell short of Consensus expectations for a reading of 30.0.
The figure is a diffusion index. Since the series' inception in 2001, there has been a 75% correlation between its level and the three-month change in U.S. factory sector production. Like the Philadelphia Fed Index of General Business Conditions, the Empire State Business Conditions Index reflects answers to independent survey questions; it is not a weighted combination of the components. The series dates back only to 2001.
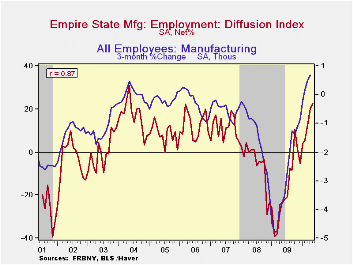
Deterioration amongst the separate survey questions was widespread this month including new orders, shipments and inventories. The employment index, however, improved to 22.37 which was the series' highest level. Since inception there has been an 87% correlation between the employment index and the three-month growth in factory sector employment as reported by the Labor Department.
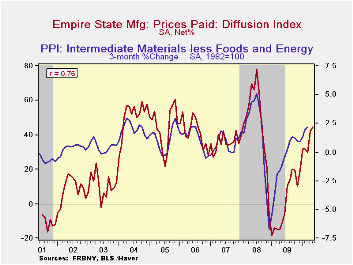
Continuing it earlier upward momentum, the prices paid index rose to 44.74, its highest since September 2008. Since inception there has been a 76% correlation between the index of prices paid and the three-month change in the core intermediate materials PPI.
The Empire State index of expected business conditions in six months fell m/m to its lowest level since August. Virtually all of the component series fell with the exceptions of capital expenditures and technology spending. They both remained near the highest levels since before the recession began.
The Empire State Manufacturing Survey is a monthly survey of manufacturers in New York State. Participants from across the state in a variety of industries respond to a questionnaire and report the change in indicators from the previous month. Each index is seasonally adjusted. Respondents also state the likely direction of these same indicators six months ahead. For more on the Empire State Manufacturing Survey, including methodologies and the latest report, click here. The Empire State data is available in Haver's SURVEYS database.
| Empire State Manufacturing Survey | May | April | March | May '09 | 2009 | 2008 | 2007 |
|---|---|---|---|---|---|---|---|
| General Business Conditions (diffusion index, %) | 19.11 | 31.86 | 22.86 | -5.64 | -2.76 | -9.97 | 17.22 |
| New Orders | 14.30 | 29.49 | 25.43 | -8.63 | -2.52 | -6.22 | 15.70 |
| Inventories | 1.32 | 11.39 | 4.94 | -35.96 | -21.59 | -7.87 | -3.95 |
| Employment | 22.37 | 20.25 | 12.35 | -23.86 | -17.28 | -5.36 | 11.28 |
| Prices Paid | 44.74 | 41.77 | 29.63 | -11.36 | 1.33 | 46.99 | 35.64 |
by Robert Brusca May 17, 2010
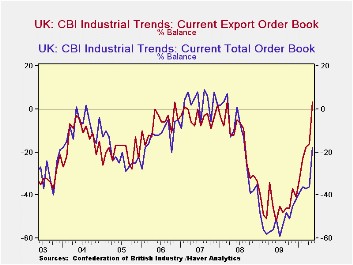
The UK CBI index improved sharply and much more sharply than expected in May. The orders index jumped from a -36 reading to -18, remaining negative but halving its negative reading. The result was completely unexpected. Export orders have improved to the point where their reading is positive for the first time since early 2008. The overall all orders index has just made the largest jump month to month since at least 1989.
The 3-month-ahead volume outlook index improved this month to a net balance reading of +17 from +14 in April. April has seen a big boost to +14 from +5 in March. The outlook volume index stands in the 77th percentile of its range which is a pretty strong standing. The export reading has tied its high since 1996 and has seen no higher reading since August of 1995.
This sort of industrial turnaround could put the BOE on the defensive. UK inflation data have not been good. But if the economy shows signs of strength the inflation data could come to have a more pejorative interpretation.
For now the rise in the industrial in orders index is sharp but only brings it to a reading of -18. Still that is a 58th percentile reading and, by itself, that is not as weak-sounding to me as a minus eighteen scoring sounds. So the BOE has balance for now. The industrial sector seems to be making a push but it is still showing a lot of weakness. Still, the main point stands. The stronger that the industrial sector and the rest of the economy gets, the more that any inflation overshoot will begin to worry the BOE.
| UK Industrial volume data CBI Survey | ||||||||||
|---|---|---|---|---|---|---|---|---|---|---|
| Reported: | May 10 |
Apr 10 |
Mar 10 |
Feb 10 |
Jan 10 |
12MO Avg | Pcntle | Max | Min | Range |
| Total Orders | -18 | -36 | -37 | -36 | -39 | -47 | 58% | 13 | -61 | 74 |
| Export Orders | 3 | -16 | -18 | -23 | -33 | -40 | 77% | 20 | -55 | 75 |
| Stocks:FinGds | 10 | 10 | 5 | 12 | 13 | 16 | 36% | 31 | -2 | 33 |
| Looking ahead | ||||||||||
| Output Volume:Nxt 3M | 17 | 14 | 5 | 7 | 4 | -3 | 77% | 36 | -48 | 84 |
| Avg Prices 4Nxt 3m | 16 | 17 | 8 | 8 | -6 | -3 | 69% | 37 | -30 | 67 |
| From early 1989 | ||||||||||
by Louise Curley May 17, 2010
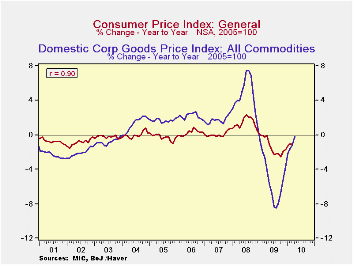
Japan's Domestic Corporate Goods Price index has been inching up in each month since November of last year. By April the index, published today, was 0.9% above November. On a year over year basis, the index in April was only 0.2% below April, 2009.
The Domestic Corporate Goods Price Index is analogous to a Wholesale or Producer Price Index. In fact, until 2002, the index was called the Wholesale Price Index. At that time, substantial revisions were made in the index, the base was changed from 1995 to 2000 and the name was changed. The base of the index is now 2005.
The rise in prices at the wholesale level, though small, gives some reason to hope that the deflation in consumer prices will also be lessening. There is a good correlation between the Domestic Corporate Goods Price Index and the Consumer Price Index as shown in the first Chart which compares the year to year changes in the two series. The year to year change in the Consumer Price Index was -1.09% in March, the latest month available. This compares with a -2.53% year to year decline in October, 2009.
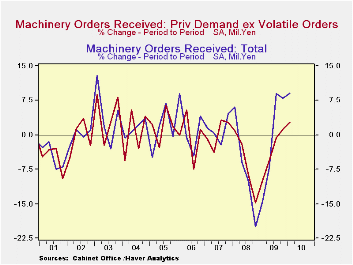
Data for machinery orders were also released today. Total orders were up 3.6% in March from February, and those for the headline series, Private machinery orders excluding volatile orders (ships and electric power) were up 5.4%. Even excluding the volatile factors, monthly orders are still erratic. As a result we have aggregated the total and the headline series to quarterly totals which are shown in the second chart. Increased activity in new orders bodes well for future sales and may have a small but positive effect on total GDP for the first quarter, which is to be published this Thursday.
| Year to Year Changes (%) | Apr 10 | Mar 10 | Feb 10 | Jan 10 | Dec 09 | Nov 09 | Oct 09 | Sep 09 |
|---|---|---|---|---|---|---|---|---|
| Domestic Corporate Goods Price Index | -0.19 | -1.25 | -1.63 | -2.20 | -3.77 | -5.02 | -6.76 | -7.88 |
| Consumer Price Index | -- | -1.09 | -1.10 | -1.29 | -1.68 | -1.87 | -2.53 | -2.24 |
| Quarter to Quarter Changes (%) | Q1 10 | Q4 09 | Q3 09 | Q2 09 | Q1 09 | Q4 08 | Q3 08 | Q2 08 |
| Total Machinery Orders | 9.02 | 8.03 | 8.99 | -7.32 | -14.47 | -19.91 | -10.12 | -5.90 |
| Private ex Volatile Orders (Head line) | 2.92 | 1.13 | -0.70 | -5.64 | -9.64 | -14.69 | -8.72 | -2.05 |
by Tom Moeller May 17,2010
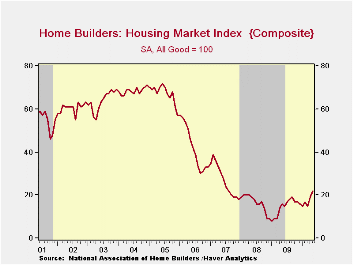
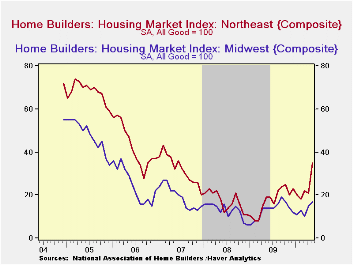
The housing market is rebounding according to the National Association of Home Builders. Their index of housing market activity rose this month to 22 from 19 in April and the latest matched the highest level since July 2007, before the recession's onset. Moreover, the index nearly tripled the low of 8 hit in January 2009. A rise in May to 20 was the Consensus expectation.
The Home builders index is compiled from survey questions asking builders to rate market conditions as “good”, “fair”, “poor” or “very high” to “very low”. The figure is thus a diffusion index with numerical results over 50 indicating a predominance of “good” readings. During the last ten years there has been a 75% correlation between the y/y change in the index and new plus existing single family home sales.
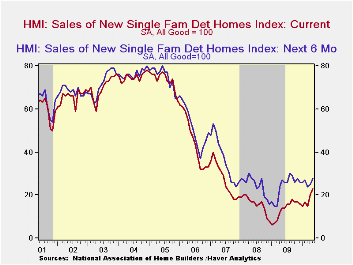
At 23, the present sales index also rose to its highest level since July 2007. The index of sales during the next six months improved, but to a lesser extent, to a reading of 28 which was the highest level since November.The Home Builders' Association also reported that the traffic of prospective buyers recovered but only to the highest level since September. Each of these NAHB figures is seasonally adjusted.
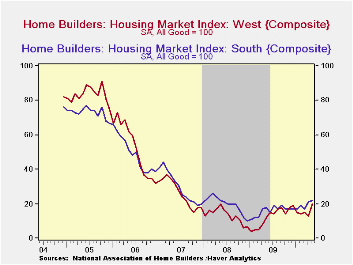
Improvement was sharpest in the Builders' index for the Northeast where the index rose to its highest level since 2007. Elsewhere, improvement was less pronounced.
The Home Builders' Housing Opportunity Index, which is the share of homes sold that could be considered affordable to a family earning the median income, slipped during 4Q '09 (the latest available figure) to 70.8%. It had jumped earlier to a record high of 72.5% buoyed by lower home prices, lower interest rates and higher income. (There is a break in the series from 2002 to 2003.)
The NAHB has compiled the Housing Market Index since 1985. The weights assigned to the individual index components are .5920 for single family detached sales, present; time, .1358 for single family detached sales, next six months; and .2722 for traffic of prospective buyers. The results, along with other housing and remodeling indexes from NAHB Economics, are included in Haver’s SURVEYS database.
| Nat'l Association of Home Builders | May | April | March | May '09 | 2009 | 2008 | 2007 |
|---|---|---|---|---|---|---|---|
| Composite Housing Market Index (All Good=100) | 22 | 19 | 15 | 16 | 15 | 16 | 27 |
| Single-Family Sales | 23 | 20 | 15 | 14 | 13 | 16 | 27 |
| Single-Family Sales: Next Six Months | 28 | 25 | 24 | 27 | 24 | 25 | 37 |
| Traffic of Prospective Buyers | 16 | 13 | 10 | 13 | 13 | 14 | 21 |

Tom Moeller
AuthorMore in Author Profile »Prior to joining Haver Analytics in 2000, Mr. Moeller worked as the Economist at Chancellor Capital Management from 1985 to 1999. There, he developed comprehensive economic forecasts and interpreted economic data for equity and fixed income portfolio managers. Also at Chancellor, Mr. Moeller worked as an equity analyst and was responsible for researching and rating companies in the economically sensitive automobile and housing industries for investment in Chancellor’s equity portfolio. Prior to joining Chancellor, Mr. Moeller was an Economist at Citibank from 1979 to 1984. He also analyzed pricing behavior in the metals industry for the Council on Wage and Price Stability in Washington, D.C. In 1999, Mr. Moeller received the award for most accurate forecast from the Forecasters' Club of New York. From 1990 to 1992 he was President of the New York Association for Business Economists. Mr. Moeller earned an M.B.A. in Finance from Fordham University, where he graduated in 1987. He holds a Bachelor of Arts in Economics from George Washington University.
More Economy in Brief


