 Global| Dec 19 2005
ECRI Leading Index: Meandering Movement
by:Tom Moeller
|in:Economy in Brief
Summary
The weekly leading index of the US economy published by the Economic Cycle Research Institute (ECRI) fell 0.1% last week following a 0.1% gain the prior week. These muted changes underscore a pattern of sideways movement in the ECRI [...]
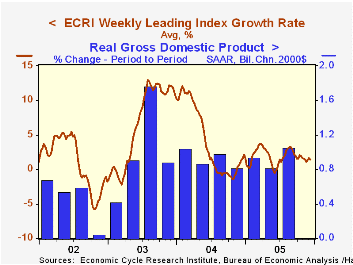
The weekly leading index of the US economy published by the Economic Cycle Research Institute (ECRI) fell 0.1% last week following a 0.1% gain the prior week. These muted changes underscore a pattern of sideways movement in the ECRI series since this past August. Growth in the index has since decelerated by more than half to 1.4%.
During the last ten years there has been a 53% correlation between the change in the weekly leading index and US real GDP growth during the following quarter. The correlation has risen to 76% during the last five years.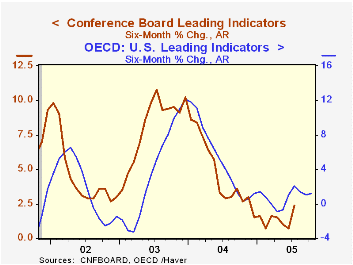
The recent deceleration in the leaders' growth is part of a longer lived deceleration since early last year when growth was near its peak of 12%. That slowdown mirrors the pattern toward slower growth in the leading series from the Conference Board and the OECD.
Visit the Economic Cycle Research Institute for analysis of US and international business cycles.
The Bretton Woods System: Are We Experiencing a Revival? Symposium Summary from the Federal Reserve Bank of San Francisco can be found here.
| Economic Cycle Research Institute | 12/09/05 | 12/31/04 | Y/Y | 2004 | 2003 | 2002 |
|---|---|---|---|---|---|---|
| Weekly Leading Index | 135.4 | 132.5 | 2.9% | 132.6 | 124.9 | 119.8 |
| 6 Month Growth Rate | 1.4% | 1.6% | 4.2% | 6.7% | 1.1% |
by Louise Curley December 19, 2005
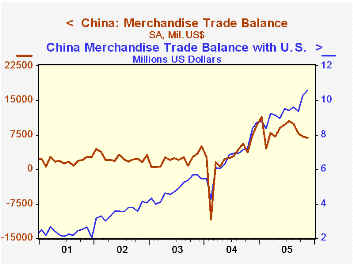
China's total balance of merchandise trade declined $328 million in November from $7,188 million in October to $6,860. China's trade balance with the United States, however, increased $267 million to $10,583 million from $10,315 million in October. Through November of this year, the cumulative over-all balance of trade was $92,049 million and that with the United States $103,348 million.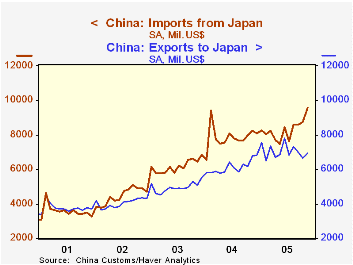
China typically runs an even larger favorable balance of trade with Hong Kong. In 2004, the balance with Hong Kong was $89,326 million compared with $80,321 million for the United States. In both countries, a large part of the Chinese exports are the products of Hong Kong and U.S. factories built in China. Because of its special relationship with China, Hong Kong is much less concerned with the imbalance in its trade with China than is the United States. The other area where China has a significant positive balance of trade is Europe. Over the past five years, the balance of trade with the United States has almost always been larger than the total balance as shown in the first chart.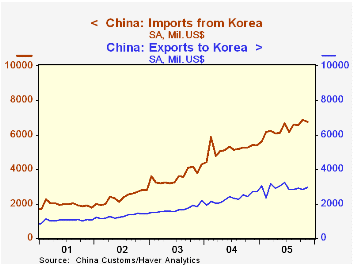
China does have substantial trade deficits on merchandise in many Asian countries. The largest of these are Taiwan, Korea and Japan. In the second and third charts, China's exports to and imports from Korea and Japan are shown. The deficit with Korea, as shown by the difference between the two series, has been growing steadily over the past several years. The deficit with Japan had been narrowing, but more recently has widened.
| China: Merchandise Trade Balances (Millions US$) | Nov 05 | Oct 05 | Nov 04 | M/M Dif | Y/Y Dif | 2004 | 2003 | 2002 |
|---|---|---|---|---|---|---|---|---|
| Total | 6,860 | 7,188 | 7,531 | -328 | -671 | 32,569 | 25,389 | 30,426 |
| With: | ||||||||
| United States | 10,583 | 10,316 | 8,344 | 267 | 2,240 | 80,321 | 58,627 | 42,731 |
| Europe | n.a. | 5,976 | 4,817 | n.a. | n.a. | 33,648 | 18,401 | 5,770 |
| Hong Kong | n.a. | 10,292 | 8,738 | n.a. | n.a. | 89,326 | 65,185 | 47,695 |
| Taiwan | -5,378 | -5,315 | -4,140 | -63 | -1,238 | -51,212 | -40,350 | -31,493 |
| Japan | -2,631 | -2,123 | -1,458 | -508 | -1,173 | -20,655 | -14,750 | -5,001 |
| Korea | -3,806 | -4,047 | -2,687 | 241 | -1,119 | -34,356 | -23,056 | -13,073 |

Tom Moeller
AuthorMore in Author Profile »Prior to joining Haver Analytics in 2000, Mr. Moeller worked as the Economist at Chancellor Capital Management from 1985 to 1999. There, he developed comprehensive economic forecasts and interpreted economic data for equity and fixed income portfolio managers. Also at Chancellor, Mr. Moeller worked as an equity analyst and was responsible for researching and rating companies in the economically sensitive automobile and housing industries for investment in Chancellor’s equity portfolio. Prior to joining Chancellor, Mr. Moeller was an Economist at Citibank from 1979 to 1984. He also analyzed pricing behavior in the metals industry for the Council on Wage and Price Stability in Washington, D.C. In 1999, Mr. Moeller received the award for most accurate forecast from the Forecasters' Club of New York. From 1990 to 1992 he was President of the New York Association for Business Economists. Mr. Moeller earned an M.B.A. in Finance from Fordham University, where he graduated in 1987. He holds a Bachelor of Arts in Economics from George Washington University.
More Economy in Brief


