 Global| Jul 24 2006
ECRI Leading Index Flat During 2006
by:Tom Moeller
|in:Economy in Brief
Summary
The weekly leading index of the US economy published by the Economic Cycle Research Institute (ECRI) was unchanged in the latest week, a performance which typifies the index's movement during 2006. Versus its year end 2005 level, the [...]
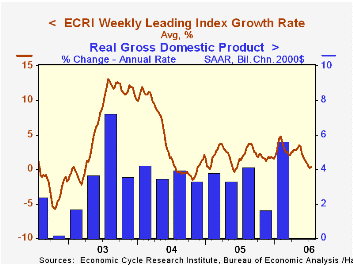
The weekly leading index of the US economy published by the Economic Cycle Research Institute (ECRI) was unchanged in the latest week, a performance which typifies the index's movement during 2006.
Versus its year end 2005 level, the leaders are up a scant 0.8% while the six month growth rate of 0.3% is down from this year's high of 4.8%.
During the last ten years there has been a 53% correlation between the change in the weekly leading index and US real GDP growth during the following quarter. The correlation has risen to 71% during the last five years.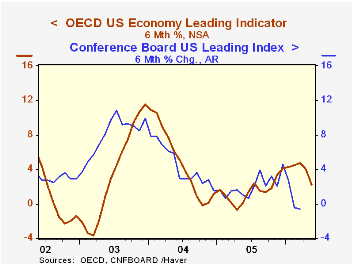
The slowdown mirrors the pattern of slower growth in the leading series of the US economy from the Conference Board and the OECD. Reduced economic liquidity as suggested by a flat interest rate yield curve and slower growth in the money supply, as well as lower housing market activity, account for much of the slowdowns.
Real GDP growth for the U.S. in 2Q is scheduled for release this coming Friday and it is generally expected at 3.0% (AR) versus 5.6% growth during 1Q.
Residential Investment over the Real Estate Cycle from the Federal Reserve Bank of San Francisco is available here.
The daily liquidity effect from the Federal Reserve bank of St. Louis can be found here.
Visit the Economic Cycle Research Institute for analysis of US and international business cycles.
| Economic Cycle Research Institute | 7/14/06 | 12/30/05 | Y/Y | 2005 | 2004 | 2003 |
|---|---|---|---|---|---|---|
| Weekly Leading Index | 136.9 | 135.8 | 1.6% | 134.6 | 132.6 | 124.9 |
| 6 Month Growth Rate | 0.3% | 1.5% | 1.9% | 4.2% | 6.7% |
by Louise Curley July 24, 2006
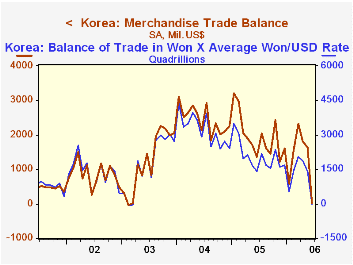
Earlier this month South Korea reported a seasonally adjusted deficit on foreign trade of 1.94 billion won in June compared with a surplus of 1,505 billion won in May. This was the first deficit since March, 2003 and was the result of a decline of 817 billion won in exports and an increase of 816 billion won in imports. Incidentally, in US dollar terms, there was a surplus of $3.78 million. This illustrates the point that one can't simply multiply the won value by the Won/Dollar rate to determine the value of the balance of trade in dollars. The correct procedure is first, to convert the won exports and imports into dollars and then the difference between the two is computed. In determining the dollar value of individual exports and imports, different exchange rates may be used depending on the timing of the exports or the imports. The difference between applying an average exchange rate to the won balance of trade and the more involved procedure is not great, but enough to turn a small deficit in won into a small surplus in dollars. In the first chart we show Korea's balance of trade in USD as reported by the Bank of Korea and the balance of trade computed by multiplying the Won value by the average exchange rate.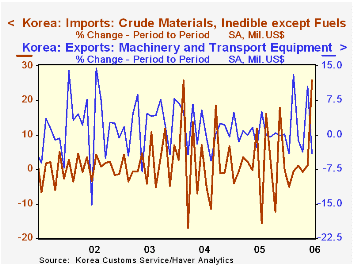
Details of the composition of exports and imports and export and import prices for June were released today. Trade by country for June is yet to be published. The biggest increase among imports of commodities was crude material including inedible, ex fuel, which increased 351 billion Won in June. Surprisingly, the category including fuel, which has seen dramatic price increases, declined 45 billion Won in June but this decline followed a peak increase of 1,724 billion Won in May. The biggest decline among exports was in machinery and transport, which declined 705 billion Won in June. The month to month changes in the import of crude material including inedible, ex fuel and the export of machinery and transport are shown in the second chart.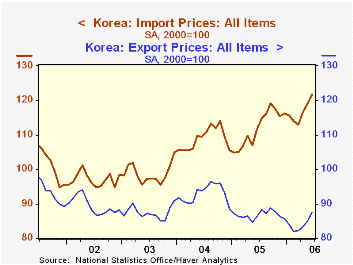
Since mid 2005, the spread between import and export prices, shown in the third chart, has been widening, with import prices rising, while export prices have tended to decline. As a result, the terms of trade for Korea have worsened steadily.
| South Korea | Jun 06 | May 06 | Jun 05 | M/M Dif | Y/Y Dif | 2005 | 2004 | 2003 |
|---|---|---|---|---|---|---|---|---|
| Exports (Bil Won) | 25810 | 26626 | 26753 | -816 | 2057 | 291579 | 290419 | 230914 |
| Imports (Bil Won) | 25911 | 25123 | 23752 | 688 | 3489 | 267443 | 256741 | 213175 |
| Balance (Bil Won) | -1.94 | 1503.25 | 1399.90 | -1505.18 | -1401.94 | 24135 | 33678 | 17739 |
| Exports (Mil USD) | 26953 | 28279 | 23369 | -1326 | 3584 | 284617 | 253845 | 193817 |
| Imports (Mil USD) | 26950 | 26646 | 21998 | 304 | 4952 | 261091 | 224462 | 178827 |
| Balance (Mil USD) | 3.78 | 1634 | 1372 | -1630 | -1368 | 23526 | 29392 | 14990 |
| Import: Crude Material, inedible ex fuels (Mil USD) | 1718 | 1368 | 1377 | 350.97 | 341.44 | 15354 | 13535 | 10147 |
| Export: Machinery & Transport (Mil USD) | 16085 | 16790 | 14024 | -705.10 | 2060.81 | 173492 | 159994 | 121142 |
| Terms of Trade (2000=100) | 71.85 | 71.50 | 72.43 | 0.49* | -7.21* | 77.56 | 85.34 | 88.85 |
| Export Prices (2000=100) | 87.45 | 85.16 | 86.32 | 2.69* | 1.61* | 86.74 | 92.93 | 87.51 |
| Import Prices (2000=100 | 121.72 | 119.10 | 111.48 | 2.20* | 9.19* | 112.03 | 108.89 | 98.85 |

Tom Moeller
AuthorMore in Author Profile »Prior to joining Haver Analytics in 2000, Mr. Moeller worked as the Economist at Chancellor Capital Management from 1985 to 1999. There, he developed comprehensive economic forecasts and interpreted economic data for equity and fixed income portfolio managers. Also at Chancellor, Mr. Moeller worked as an equity analyst and was responsible for researching and rating companies in the economically sensitive automobile and housing industries for investment in Chancellor’s equity portfolio. Prior to joining Chancellor, Mr. Moeller was an Economist at Citibank from 1979 to 1984. He also analyzed pricing behavior in the metals industry for the Council on Wage and Price Stability in Washington, D.C. In 1999, Mr. Moeller received the award for most accurate forecast from the Forecasters' Club of New York. From 1990 to 1992 he was President of the New York Association for Business Economists. Mr. Moeller earned an M.B.A. in Finance from Fordham University, where he graduated in 1987. He holds a Bachelor of Arts in Economics from George Washington University.
More Economy in Brief


