 Global| Sep 19 2005
ECRI Leading Index: Down But Not Out
by:Tom Moeller
|in:Economy in Brief
Summary
The leading index of the US economy published weekly by the Economic Cycle Research Institute (ECRI) fell during four of the last five weeks. The latest 0.4% w/w decline reflected, in part, the sharp rise in initial claims for [...]
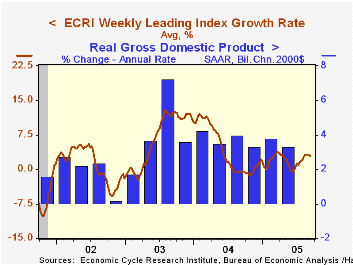
The leading index of the US economy published weekly by the Economic Cycle Research Institute (ECRI) fell during four of the last five weeks. The latest 0.4% w/w decline reflected, in part, the sharp rise in initial claims for unemployment insurance due to Hurricane Katrina.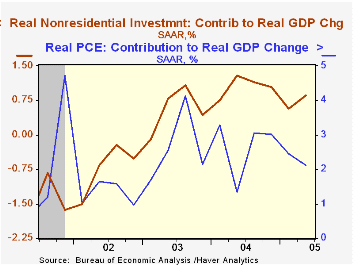
These weekly declines, however, are modest compared to past periods when economic recession was indicated. The six month growth rate of the leading index has held at roughly 3%, still up from the June low of -0.6% and from the -5% to -7% growth rates which preceded the last recession.
During the last ten years there has been a 53% correlation between the change in the weekly leading index and US real GDP growth during the following quarter. The correlation has risen to 76% during the last five years.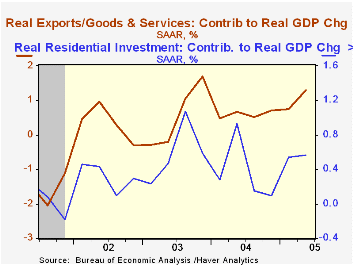
ECRI's research director indicated that "The economy was at a phase of the business cycle where it was relatively resilient to any type of shock. The reality is that the potency of a shock, how much influence it can have, really depends on where we are in the business cycle."
The accompanying charts indicate some of that resiliency. Recent US economic growth has been less due to consumer spending & housing and more due to exports & business fixed investment. Moreover, core price inflation recently has been low and declining rather than high and rising.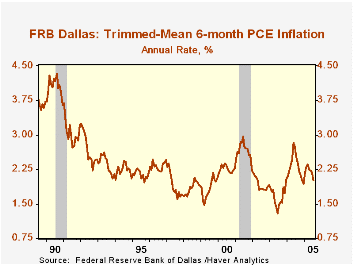
Visit the Economic Cycle Research Institute for analysis of US and international business cycles.
| Economic Cycle Research Institute | 09/09/05 | 12/31/04 | Y/Y | 2004 | 2003 | 2002 |
|---|---|---|---|---|---|---|
| Weekly Leading Index | 135.2 | 135.8 | 2.9% | 132.6 | 124.9 | 119.8 |
| 6 Month Growth Rate | 2.9% | 3.1% | 4.2% | 6.7% | 1.1% |
by Louise Curley September 19, 2005
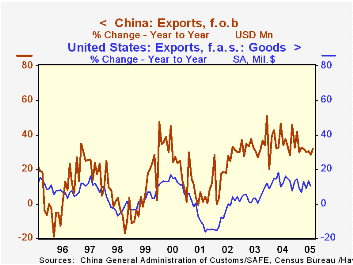
August exports of goods from the Republic of China recorded a 32% increase over the year ago figure according to the CEIC data that are available in Haver's CEIC China Premium Database. At this pace, it is not surprising that OECD (Organization for Economic and Development) in its first Survey of China suggests that China could overtake the United States and Germany as the world's largest exporter, in the next five years. A summary of the OECD Economic Survey of China can be found at here.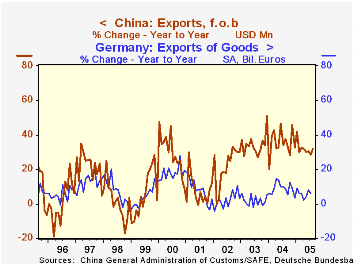
The growth in China's exports of goods compared with that of the U.S. is shown in the first chart, and with that of Germany in the second chart. The data for Germany and the
U. S. are only through July. The differences between the growth rates of China versus the U. S. and China versus Germany have been consistently large over the past few years. Exports of goods and the annual growth rates for the three countries are shown below for the past five years. In 2004, exports of goods from the U. S., Germany and China were, respectively, $816 billion, $912 billion and $593 billion.
| (Million of U. S. Dollars) | Aug 05 | Jul 05 | Aug 04 | M/M % | Y/Y % | 2004 | 2003 | 2002 |
|---|---|---|---|---|---|---|---|---|
| Chinese exports of goods | 67820 | 65584 | 51400 | 3.41 | 31.95 | 593232 | 438250 | 325711 |
| Total Exports of Goods | 2004 | 2003 | 2002 | 2001 | 2000 | |||
| United States | 816395 | 723611 | 693123 | 730906 | 771991 | |||
| Germany | 911889 | 742063 | 612794 | 570275 | 548785 | |||
| China | 593232 | 438250 | 325711 | 266698 | 249195 | |||
| Annual Percent Change | ||||||||
| United States | 12.82 | 4.40 | -5.17 | -5.32 | 11.27 | |||
| Germany | 22.86 | 21.10 | 7.45 | 3.92 | 2.48 | |||
| China | 35.36 | 34.55 | 22.13 | 7.02 | 27.84 |
by Tom Moeller September 19, 2005
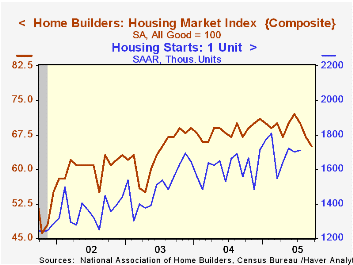
The National Association of Home Builders' (NAHB) Composite Housing Market Index fell for the third straight month in September to 65 from an unrevised 67 in August. The latest was the lowest level since July 2003.
During the last twenty years, year to year changes in the annual composite index had an 85% correlation with the change in single family housing starts.
The m/m decline was spread throughout the country.
The September index for sales of single family homes in six months fell sharply to 69 (-8.0% y/y) while the index for current sales fell moderately to 72 (-1.4% y/y).
The NAHB index is a diffusion index based on a survey of builders. Readings above 50 signal that more builders view conditions as good than poor.
Visit the National Association of Home Builders.
| Nat'l Association of Home Builders | Sept | Aug | Sept '04 | 2004 | 2003 | 2002 |
|---|---|---|---|---|---|---|
| Composite Housing Market Index | 65 | 67 | 67 | 68 | 64 | 61 |

Tom Moeller
AuthorMore in Author Profile »Prior to joining Haver Analytics in 2000, Mr. Moeller worked as the Economist at Chancellor Capital Management from 1985 to 1999. There, he developed comprehensive economic forecasts and interpreted economic data for equity and fixed income portfolio managers. Also at Chancellor, Mr. Moeller worked as an equity analyst and was responsible for researching and rating companies in the economically sensitive automobile and housing industries for investment in Chancellor’s equity portfolio. Prior to joining Chancellor, Mr. Moeller was an Economist at Citibank from 1979 to 1984. He also analyzed pricing behavior in the metals industry for the Council on Wage and Price Stability in Washington, D.C. In 1999, Mr. Moeller received the award for most accurate forecast from the Forecasters' Club of New York. From 1990 to 1992 he was President of the New York Association for Business Economists. Mr. Moeller earned an M.B.A. in Finance from Fordham University, where he graduated in 1987. He holds a Bachelor of Arts in Economics from George Washington University.
More Economy in Brief


