 Global| Feb 27 2003
Durable Goods Orders Up Sharply
by:Tom Moeller
|in:Economy in Brief
Summary
Durable goods orders rose much more than expected last month. The gain followed a slight December decline that was revised from a slight gain. Consensus expectations had been for a 1.0% rise. The rise in durable orders caught up with [...]
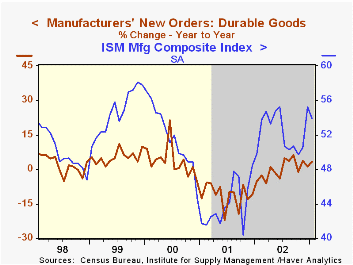
Durable goods orders rose much more than expected last month. The gain followed a slight December decline that was revised from a slight gain. Consensus expectations had been for a 1.0% rise.
The rise in durable orders caught up with the sharp improvement in the ISM orders index in December. That index fell in January but remained at a fairly high level. During the last ten years there has been a 47% correlation between the annual change in orders for durable goods and the level of the ISM orders index.
Higher orders for motor vehicles and parts, up 10.7%, accounted for much of the January strength in durable orders, but aircraft & parts orders fell sharply. Orders excluding all transportation equipment rose 2.5% (4.3% y/y) following a 1.0% December gain.
Orders for nondefense capital goods were strong for the second consecutive month. Capital goods orders excluding aircraft and parts rose 5.4% (3.8% y/y) following a downwardly revised December, now off 0.6%. These orders fell 3.0% in November.
Orders for computers and electronic products surged for the second consecutive month, up 3.2% (2.9% y/y). Machinery orders also posted a strong 5.3% (3.6% y/y) gain. Orders for electrical equipment rose 0.8% (5.6% y/y) following a downwardly revised December.
Shipments of durable goods rose 3.5% (0.6% y/y) and recouped most of the decline over the prior two months. Shipments excluding all transportation categories have been firmer of late and rose 1.9% (+1.9% y/y) following two months of slight decline.
Durable inventories fell 0.1% (-3.4% y/y) following the 0.9% December gain. Excluding all transportation, inventories fell 0.2% (-4.0% y/y).
| NAICS Classification | Jan | Dec | Y/Y | 2002 | 2001 | 2000 |
|---|---|---|---|---|---|---|
| Durable Goods Orders | 3.3% | -0.4% | 3.4% | -0.1% | -11.4% | 3.3% |
| Nondefense Capital Goods | 2.1% | 2.4% | 4.3% | -5.3% | -16.5% | 7.9% |
by Tom Moeller February 27, 2003
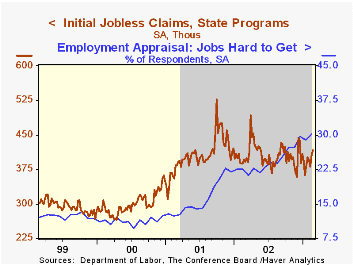
Initial claims for unemployment insurance rose unexpectedly last week from an upwardly revised level the week prior. Claims rose 2.7% from the prior week's level and are at the highest level since early December.
The four-week moving average of initial claims rose to 399,750 (2.5% y/y).
Continuing claims for unemployment insurance fell 1.3% from the prior week's level which was revised down. The claimant level so far in February is up 2.5% from January.
The insured rate of unemployment was stable at 2.7%.
| Unemployment Insurance (000s) | 2/22/03 | 2/15/03 | Y/Y | 2002 | 2001 | 2000 |
|---|---|---|---|---|---|---|
| Initial Claims | 417.0 | 406.0 | 5.3% | 405.0 | 405.8 | 299.8 |
| Continuing Claims | -- | 3,377 | -3.8% | 3,588 | 3,021 | 2,114 |
by Tom Moeller February 27, 2003
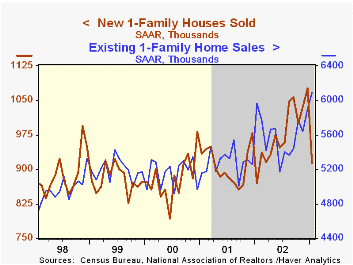
Sales of new single family homes were weaker than expected last month. Sales fell 15.1% from December's record level which was revised slightly lower. It was the lowest level for new home sales since last January. Consensus expectations were for a 1.050 Mil. sales rate in January.
Sales fell in each of the country’s regions, except in the Northeast. Sales in the Midwest fell 42.2% m/m (-9.4% y/y). Sales in the South fell 12.9% (4.1% y/y). In the West sales fell moderately for the third month (21.3% y/y). Sales in the Northeast rose 43.4% (-5.7% y/y).
The median price of a new home fell 5.2% to $182,300 (-2.6% y/y).
The new home sales data reflect current sales versus the existing home sale figures which reflect closings on past sales.
| Homes Sales (000s, AR) | Jan | Dec | Y/Y | 2002 | 2001 | 2000 |
|---|---|---|---|---|---|---|
| New Single-Family | 914 | 1,077 | 5.1% | 979 | 908 | 880 |
by Tom Moeller February 27, 2003
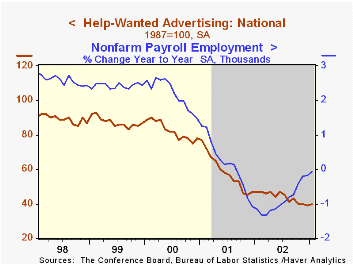
The Conference Board's National Index of Help-Wanted Advertising rose in January, but only back to the depressed levels of October and November.
The proportion of labor markets with rising want-ad volume improved to 47% from a downwardly revised 41% in December, originally reported at 47%.
The changes in want-ad volumes were quite mixed across the country's regions.
During the last ten years there has been a 66% correlation between the level of help-wanted advertising and the monthly change in nonfarm payrolls. The correlation with the y/y change in employment has been 92%.
All of the figures mentioned above are seasonally adjusted.
| Conference Board | Jan '03 | Dec '02 | Jan '02 |
|---|---|---|---|
| National Help Wanted Index | 40 | 39 | 47 |

Tom Moeller
AuthorMore in Author Profile »Prior to joining Haver Analytics in 2000, Mr. Moeller worked as the Economist at Chancellor Capital Management from 1985 to 1999. There, he developed comprehensive economic forecasts and interpreted economic data for equity and fixed income portfolio managers. Also at Chancellor, Mr. Moeller worked as an equity analyst and was responsible for researching and rating companies in the economically sensitive automobile and housing industries for investment in Chancellor’s equity portfolio. Prior to joining Chancellor, Mr. Moeller was an Economist at Citibank from 1979 to 1984. He also analyzed pricing behavior in the metals industry for the Council on Wage and Price Stability in Washington, D.C. In 1999, Mr. Moeller received the award for most accurate forecast from the Forecasters' Club of New York. From 1990 to 1992 he was President of the New York Association for Business Economists. Mr. Moeller earned an M.B.A. in Finance from Fordham University, where he graduated in 1987. He holds a Bachelor of Arts in Economics from George Washington University.
More Economy in Brief


