 Global| Mar 26 2003
Durable Goods Orders Fell
by:Tom Moeller
|in:Economy in Brief
Summary
Durable goods orders fell about as expected last month. The sharp gain in January orders was revised down significantly. Consensus expectations had been for a 1.0% decline in February orders. The recent volatility in orders has been [...]

Durable goods orders fell about as expected last month. The sharp gain in January orders was revised down significantly. Consensus expectations had been for a 1.0% decline in February orders.
The recent volatility in orders has been amplified by huge swings in bookings for commercial aircraft and parts which fell 26.4% last month following a 24.5% January decline. Orders excluding all transportation equipment fell 2.1% (1.5% y/y) following a 1.2% January gain that was half the initially reported rise.
Orders for motor vehicles and parts also have been quite volatile recently, down 1.5% last month following a 9.9% January gain.
Orders for nondefense capital goods fell sharply in February and to the lowest level since September. Capital goods orders excluding aircraft and parts fell 2.8% (-1.8% y/y) and have been moving sideways for the last year.
Orders for computers and electronic products fell 2.9% and gave back all of the prior month's strong gain. Machinery orders also dropped a sharp 2.5%, down for the third month in four. Orders for electrical equipment dropped sharply (1.9%) for the fourth month in five.
Shipments of durable goods fell 1.6% (0.7% y/y) and have been trending moderately lower since last June. Shipments excluding all transportation categories also have been trending lower and fell 2.8% in February.
Durable inventories fell 0.1% (-2.7% y/y). Excluding all transportation categories, inventories fell 0.3% (-3.3% y/y) following a 0.4% decline in January.
| NAICS Classification | Feb | Jan | Y/Y | 2002 | 2001 | 2000 |
|---|---|---|---|---|---|---|
| Durable Goods Orders | -1.2% | 1.9% | -1.0% | -0.1% | -11.4% | 3.3% |
| Nondefense Capital Goods | -5.2% | 1.0% | -3.7% | -5.3% | -16.5% | 7.9% |
by Tom Moeller March 26, 2003
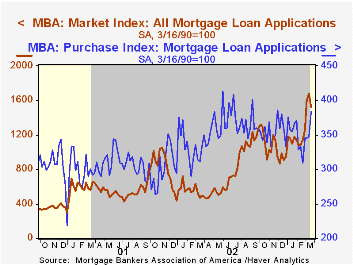
The index of mortgage applications compiled by the Mortgage Bankers Association fell 9.1% last week but still are up 20.2% during the month of March.
Last week's decline was led by a 13.3% decline in applications to refinance which still have risen 23.0% in March.
Mortgage applications for home purchase were strong last week, up 10.5% to the highest level since late November.
The average size of a mortgage loan application was $182,800. The average size of an application for home purchase was $193,800.
Interest rates on a conventional 30-Year mortgage firmed last week. The contract rate rose to 5.81% from 5.61% and the effective rate (incl. points) rose to 6.13%. The effective rate on a 15-year mortgage rose to 5.51%.
For a description of the mortgage application indexes from the Mortgage Bankers Association click here.
| MBA Mortgage Applications (3/16/90=100) | 3/21/03 | 3/14/03 | 2002 | 2001 | 2000 |
|---|---|---|---|---|---|
| Total Market Index | 1,520.9 | 1,673.4 | 799.7 | 625.6 | 322.7 |
| Purchase | 383.7 | 347.3 | 354.7 | 304.9 | 302.7 |
| Refinancing | 8,135.7 | 9,387.0 | 3,388.0 | 2,491.0 | 438.8 |
by Tom Moeller March 26, 2003
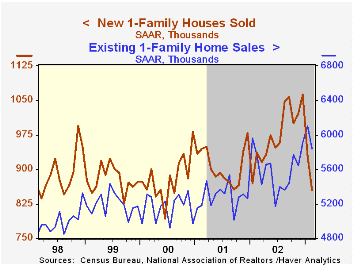
Sales of new single family homes fell much more than expected last month. Sales fell 8.1% from January's level which was revised slightly higher. Consensus expectations were for a 920,000 sales rate in February.
Sales probably were depressed by severe Winter weather as evidenced by the sharp 36.8% m/m decline in sales in the Northeast region of the country, but weakness elsewhere indicates a general softening of sales.
Sales in the Midwest fell 6.3% following a sharp 42.4% m/m decline in January. Sales in the South fell 8.6% for the second consecutive monthly drop. In the West sales were unchanged following declines in the three prior months.
The median price of a new home rose 5.1% to $188,800 (-1.2% y/y) but the prior month was revised down sharply.
Recent analysis of House Price Bubbles by the Federal Reserve Bank of San Francisco can be found here.
The new home sales data reflect current sales versus the existing home sale figures which reflect closings on past sales.
| Homes Sales (000s, AR) | Feb | Jan | Y/Y | 2002 | 2001 | 2000 |
|---|---|---|---|---|---|---|
| New Single-Family | 854 | 929 | -8.9% | 979 | 908 | 880 |

Tom Moeller
AuthorMore in Author Profile »Prior to joining Haver Analytics in 2000, Mr. Moeller worked as the Economist at Chancellor Capital Management from 1985 to 1999. There, he developed comprehensive economic forecasts and interpreted economic data for equity and fixed income portfolio managers. Also at Chancellor, Mr. Moeller worked as an equity analyst and was responsible for researching and rating companies in the economically sensitive automobile and housing industries for investment in Chancellor’s equity portfolio. Prior to joining Chancellor, Mr. Moeller was an Economist at Citibank from 1979 to 1984. He also analyzed pricing behavior in the metals industry for the Council on Wage and Price Stability in Washington, D.C. In 1999, Mr. Moeller received the award for most accurate forecast from the Forecasters' Club of New York. From 1990 to 1992 he was President of the New York Association for Business Economists. Mr. Moeller earned an M.B.A. in Finance from Fordham University, where he graduated in 1987. He holds a Bachelor of Arts in Economics from George Washington University.
More Economy in Brief


