Global| May 28 2003
Durable Goods Orders Down
by:Tom Moeller
|in:Economy in Brief
Summary
Durable goods orders fell 2.4% last month, somewhat more than expected, and the strong gain in March was revised lower to 1.4%. Consensus expectations had been for a 1.0% decline in April orders. The decline in orders last month was [...]
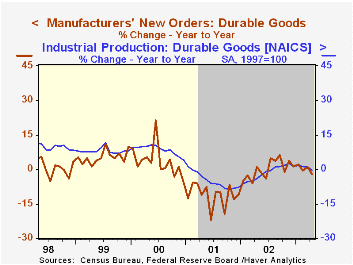
Durable goods orders fell 2.4% last month, somewhat more than expected, and the strong gain in March was revised lower to 1.4%. Consensus expectations had been for a 1.0% decline in April orders.
The decline in orders last month was broad based, but weakness in transportation orders was pronounced, off 5.4% (-1.0% y/y). Orders for motor vehicles & parts slid 3.0% (-10.0% y/y). Orders for aircraft & parts fell 1.0% led by a sharp 26.4% drop in defense bookings. Excluding the transportation sector, durable orders fell 1.2% (-2.4% y/y.
Orders for electrical equipment fell 3.6% (-9.9% y/y) and that dropped these orders 18.2% below the average of 2000. Machinery orders also fell hard, off 3.7% (-2.7% y/y). Orders for computers and electronic products fared relatively well and were unchanged (0.2% y/y).
Nondefense capital goods orders excluding aircraft and parts fell 3.0% (0.6% y/y).
During the last ten years there has been a 74% correlation between the y/y change in orders for durable goods and the change in industrial production of durable goods.
Shipments of durable goods slipped 0.7% (-3.5% y/y) and that lowered shipments 2.2% below the average of last year.
Durable inventories fell 0.1% (-1.5% y/y), an unchanged March reading was revised to -0.2% and it was the fourth consecutive monthly decline.
| NAICS Classification | April | Mar | Y/Y | 2002 | 2001 | 2000 |
|---|---|---|---|---|---|---|
| Durable Goods Orders | -2.4% | 1.4% | -2.0% | -0.1% | -11.4% | 3.3% |
| Nondefense Capital Goods | -0.3% | 3.1% | 2.6% | -5.3% | -16.5% | 7.9% |
by Tom Moeller May 28, 2003
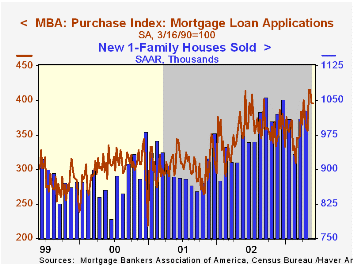
The index of mortgage applications compiled by the Mortgage Bankers Association added 4.6% last week to the double digit gains of the prior three weeks. During the last four weeks mortgage applications have risen by 55.6%.
Applications to refinance rose 5.9% w/w to a level just 5.8% below the weekly peak in March.
Applications for home purchase were about unchanged yet still are up 8.7% this month versus April.
Interest rates on a conventional 30-Year mortgage fell to a new low with the effective rate at 5.40% versus 6.13% averaged in December. The effective rate on a 15-year mortgage rose slightly w/w to 4.97% versus 5.55% averaged in December.
The average size of a mortgage loan application rose for the fourth straight week to $195,700 (4.3% y/y). The average size of an application for home purchase fell slightly to $199,300 (7.6% y/y). The average size of an application to refinance rose 2.2% to $194,600 (1.7% y/y).
The Mortgage Bankers Association surveys between 20 to 35 of the top lenders in the U.S. housing industry to derive its refinance, purchase and market indexes. The weekly survey accounts for more than 40% of all applications processed each week by mortgage lenders.
Visit the Mortgage Bankers Association site at www.mbaa.org.
| MBA Mortgage Applications (3/16/90=100) | 5/23/03 | 5/16/03 | 2002 | 2001 | 2000 |
|---|---|---|---|---|---|
| Total Market Index | 1,634.6 | 1,562.8 | 799.7 | 625.6 | 322.7 |
| Purchase | 395.7 | 395.8 | 354.7 | 304.9 | 302.7 |
| Refinancing | 8,840.9 | 8,351.1 | 3,388.0 | 2,491.0 | 438.8 |
by Tom Moeller May 28, 2003
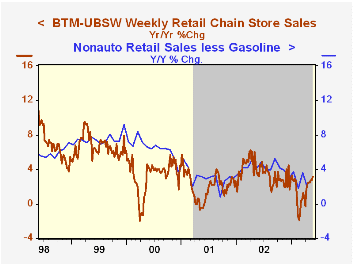
Chain store sales rose 0.1% last week following a 0.1% dip the prior week, according to the BTM-UBSW survey.
So far in May sales were 2.0% above the April average owing to a sharp 2.1% jump in the first week of the month.
During the last five years there has been a 59% correlation between the year-to-year percent change in chain store sales and the change in nonauto retail sales less gasoline.
The BTM-UBSW retail chain-store sales index is constructed from the sales results reported by seven retailers: Dayton Hudson, Federated, Kmart, May, J.C. Penney, Sears and Wal-Mart.
| BTM-UBSW (SA, 1977=100) | 5/24/03 | 5/17/03 | Y/Y | 2002 | 2001 | 2000 |
|---|---|---|---|---|---|---|
| Total Weekly Retail Chain Store Sales | 417.0 | 416.5 | 3.1% | 3.6% | 2.1% | 3.4% |

Tom Moeller
AuthorMore in Author Profile »Prior to joining Haver Analytics in 2000, Mr. Moeller worked as the Economist at Chancellor Capital Management from 1985 to 1999. There, he developed comprehensive economic forecasts and interpreted economic data for equity and fixed income portfolio managers. Also at Chancellor, Mr. Moeller worked as an equity analyst and was responsible for researching and rating companies in the economically sensitive automobile and housing industries for investment in Chancellor’s equity portfolio. Prior to joining Chancellor, Mr. Moeller was an Economist at Citibank from 1979 to 1984. He also analyzed pricing behavior in the metals industry for the Council on Wage and Price Stability in Washington, D.C. In 1999, Mr. Moeller received the award for most accurate forecast from the Forecasters' Club of New York. From 1990 to 1992 he was President of the New York Association for Business Economists. Mr. Moeller earned an M.B.A. in Finance from Fordham University, where he graduated in 1987. He holds a Bachelor of Arts in Economics from George Washington University.
More Economy in Brief