 Global| Jun 25 2009
Decline in U.S. 1Q GDP IsTrimmed
by:Tom Moeller
|in:Economy in Brief
Summary
The Commerce Department indicated that the second and "final" estimate of 1Q '09 real GDP was -5.5% (AR), little different from the "preliminary" estimate released last month. The large drop, however, came on the heels of the 6.3% [...]

The Commerce Department indicated that the second and "final" estimate of 1Q '09 real GDP was -5.5% (AR), little different from the "preliminary" estimate released last month. The large drop, however, came on the heels of the 6.3% decline during 4Q '08 and together they were the worst since early-1958. The latest revision compares to Consensus expectations for a 5.7% decline.
Total corporate profits also were revised little and posted a
3.8% (-17.6% y/y) increase due to the near-doubling of financial sector
earnings versus 4Q. Nevertheless, these earnings were still off by
42.1% from 1Q '08.  The decline in nonfinancial sector earnings was
lessened slightly to 6.6% (-11.5% y/y) following a 10.7% 4Q decline,
but as recessions abroad progressed, the decline in earnings in the
foreign sector was deepened to 4.2% (-4.8% y/y).
The decline in nonfinancial sector earnings was
lessened slightly to 6.6% (-11.5% y/y) following a 10.7% 4Q decline,
but as recessions abroad progressed, the decline in earnings in the
foreign sector was deepened to 4.2% (-4.8% y/y).
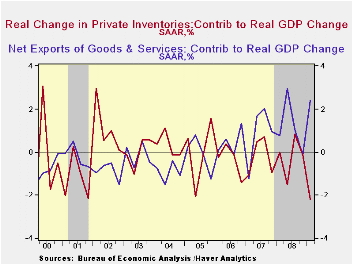
The GDP effect of the reduction of unwanted inventories, in the face of declining demand, was revised little at -2.2 percentage points. Regardless, the subtraction was the most since the first quarter of 2000 and it rivals the largest negative contribution from inventories since the early-1980s. Real U.S. final sales to domestic purchasers fell at a little-revised 5.4% rate. Combined with the 4Q '08 decline of 5.8%, final sales to domestic purchasers fell the most since 1958.
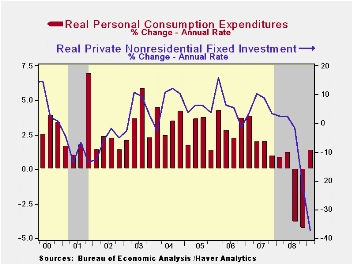
The rise in personal consumption expenditures last quarter again was lessened slightly to 1.4% (-1.4% y/y). This modest increase followed sharp declines during the prior two quarters. Spending on motor vehicles rose moderately during the quarter (-18.7% y/y) after five consecutive down periods. As corporate profits fell along with the prospects for overall economic growth, business fixed investment fell at a 37.3% rate (-16.1% y/y) and residential investment dropped at an unrevised 38.8% rate (-23.4% y/y) from 4Q.
 The significant shortfall in expenditures by the government
sector still accounts for a significant portion of last quarter's
weakness in GDP. The little revised 3.1% decline was the first since
late-2005. The drop was led by a 4.4% decline (+5.5% y/y) in Federal
spending that was paced by a 6.7% decline (+5.1% y/y) in defense
expenditures. Budget cutbacks due to the decline in tax revenues with
the recession caused state & local spending to fall at a 2.2%
annual rate (-0.1% y/y).
The significant shortfall in expenditures by the government
sector still accounts for a significant portion of last quarter's
weakness in GDP. The little revised 3.1% decline was the first since
late-2005. The drop was led by a 4.4% decline (+5.5% y/y) in Federal
spending that was paced by a 6.7% decline (+5.1% y/y) in defense
expenditures. Budget cutbacks due to the decline in tax revenues with
the recession caused state & local spending to fall at a 2.2%
annual rate (-0.1% y/y).
The foreign trade sector made up for some of the domestic economy's weakness as net exports contributed a little-revised 2.4 percentage points to 1Q GDP growth. Imports fell at a 36.4% annual rate (-17.2% y/y) while recessions abroad pulled U.S. exports down at a lesser 30.6% rate (-11.5% y/y).
 Inflation continued to show signs of firming. The unrevised
2.8% increase in the GDP chain price index was up
from the 0.5% annual rate of increase during 4Q. The reason for the
acceleration is that import prices fell at a faster rate than export
prices. Domestic prices, however, reflected the weak economy and fell
at a 1.0% annual rate (+0.8% y/y) after a 4.3% 4Q decline.The PCE price
index fell at a 0.9% annual rate (+0.8% y/y) while the residential
investment chain price index fell at a 4.9% rate (-5.3% y/y). The
weakness in business spending caused the nonresidential investment
price index also to slip at a 1.5% rate (+2.4% y/y), the first
quarterly decline since 2007.
Inflation continued to show signs of firming. The unrevised
2.8% increase in the GDP chain price index was up
from the 0.5% annual rate of increase during 4Q. The reason for the
acceleration is that import prices fell at a faster rate than export
prices. Domestic prices, however, reflected the weak economy and fell
at a 1.0% annual rate (+0.8% y/y) after a 4.3% 4Q decline.The PCE price
index fell at a 0.9% annual rate (+0.8% y/y) while the residential
investment chain price index fell at a 4.9% rate (-5.3% y/y). The
weakness in business spending caused the nonresidential investment
price index also to slip at a 1.5% rate (+2.4% y/y), the first
quarterly decline since 2007.
The U.S. National Income & Product Account data is available in Haver's USECON and the USNA databases.
Acquisition of Merrill Lynch by Bank of America is this morning's testimony by Fed Chairman Ben S. Bernanke and it is available here.
| Chained 2000$, % AR | 1Q '09 (Final) | 1Q '09 (Preliminary) | 1Q '09 (Advance) | 4Q '08 | 1Q Y/Y | 2008 | 2007 | 2006 |
|---|---|---|---|---|---|---|---|---|
| GDP | -5.5 | -5.7 | -6.1 | -6.3 | -2.5 | 1.1 | 2.0 | 2.8 |
| Inventory Effect | -2.2 | -2.3 | -2.8 | -0.1 | -0.8 | 0.1 | -0.4 | 0.0 |
| Final Sales | -3.3 | -3.4 | -3.4 | -6.2 | -1.7 | 1.4 | 2.4 | 2.8 |
| Foreign Trade Effect | 2.4 | 2.2 | 2.0 | -0.2 | -1.4 | 1.4 | 0.6 | 0.2 |
| Domestic Final Demand | -5.4 | -5.3 | -5.1 | -5.8 | -3.1 | -0.0 | 1.8 | 2.6 |
| Chained GDP Price Index | 2.8 | 2.8 | 2.9 | 0.5 | 2.1 | 2.2 | 2.7 | 3.2 |
by Robert Brusca June 25, 2009
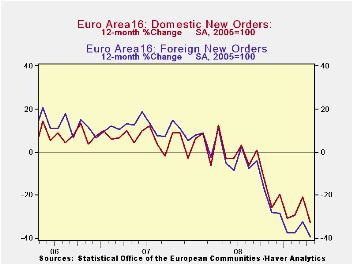
Orders in the Area fell by 32.1% a new Yr/Yr record leading to
headlines about how slow the European recovery is going to be. But the
pace of decline in orders over three months has been sharply reduced to
an annual rate of decline of 8.2% compared to 30-plus percent drop over
six months and 12-months. Both foreign-sourced and domestic–sourced
orders have trimmed their respective rates of decline sharply over
three months. The strongly negative Yr/Yr growth rate is mostly due to
legacy weakness over the earlier period.
Country level statistics are encouraging. Germany and France
have cut their respective three month growth rate declines to a pace
that is single digits; the annualized rate of decline is less than a 5%
pace. Italy is still shedding orders at nearly a 30% pace. In the UK a
spike in orders has boosted the three month growth rate to a +53%
annual rate.
Other signs in the Area show improvement as well. Italy,
despite pronounced order weakness, has been showing improved confidence
for both businesses and households. It posted a surprise rise in IP as
well. The EMU-wide PMI indices for MFG and for Services are showing
improvement on the month. On balance their trends are nothing to be
disappointed about, taking into account the extent of the weakness in
the Area which has hit countries somewhat unevenly and where fiscal
responses have been far from uniform as well. For example The
Netherlands today confirmed that its GDP drop in Q1 was the worst in
sixty years. It takes time to come back from that kind of weakness
| E-Area-13 and UK Industrial Orders | ||||||||||
|---|---|---|---|---|---|---|---|---|---|---|
| Saar except m/m | Mo/Mo | Apr-09 | Mar-09 | Apr-09 | Mar-09 | Apr-09 | Mar-09 | |||
| E-Area Detail | Apr-09 | Mar-09 | Feb-09 | 3-Mo | 3-Mo | 6-mo | 6-mo | 12-mo | 12-mo | |
| MFG Orders | -1.0% | -0.2% | -0.9% | -8.2% | -14.0% | -34.4% | -42.0% | -32.1% | -31.0% | |
| Memo:MFG | ||||||||||
| E-13 Domestic MFG orders | -0.5% | -1.4% | 1.7% | -0.9% | -11.9% | -34.4% | -39.7% | -32.5% | -20.8% | |
| E-13 Foreign MFG orders | -2.1% | -0.6% | 1.5% | -5.1% | -25.8% | -43.5% | -49.2% | -39.5% | -32.3% | |
| Countries: | Apr-09 | Mar-09 | Feb-09 | 3-Mo | 3-Mo | 6-mo | 6-mo | 12-mo | 12-mo | |
| Germany (MFG): | -1.1% | 3.7% | -3.3% | -3.4% | -27.7% | -39.8% | -47.0% | -35.6% | -34.3% | |
| France (Ind): | 0.9% | -7.4% | 6.7% | -1.4% | -13.9% | -18.9% | -34.9% | -30.4% | -24.7% | |
| Italy (Ind): | -3.7% | -2.7% | -2.2% | -29.4% | -30.0% | -36.9% | -40.1% | -31.8% | -29.9% | |
| UK (Engineering Industy): | -8.3% | 7.1% | 13.3% | 53.0% | -56.3% | -28.2% | -45.2% | -27.0% | -11.4% | |
by Tom Moeller June 25, 2009

Earlier improvement in the labor market improvement stalled in June. Initial claims for unemployment insurance edged up last week by 15,000 to 627,000, their highest level since May. The latest increase followed a modest 7,000 rise during the prior week. Despite these gains, however, initial claims were down from their March peak of 674,000. In addition, the four-week average of claims, which smoothes out some of the volatility in the weekly numbers, fell slightly to 617,250 which was its lowest level since since mid-February. The latest weekly level by far exceeded the Consensus expectation for 601,000 claims.
The Labor Department indicated that the largest increases in
initial claims for the week ending June 13 were in Florida (+8,383),
Pennsylvania (+3,191), Missouri (+2,874), Puerto Rico (+2,561), and
California (+2,540), while the largest decreases were in Michigan
(-5,414), New York (-5,299), North Carolina (-4,714), Tennessee
(-4,414), and Ohio (-3,802).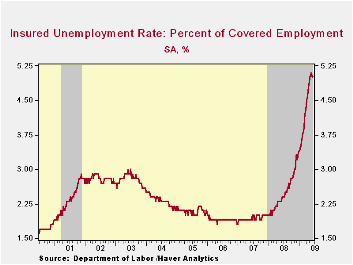
Though continuing claims for unemployment inched up in the latest week, modest improvement in the job market still is evident in the figures. Claims rose a slight 29,000 following a sharp 126,000 decline from their high during the prior week. Continuing claims provide an indication of workers' ability to find employment. At 6,738,000, however, claims remained more than twice the year ago level. Further suggesting that the job market's improvement is just modest was that the four-week average of continuing claims fell just slightly from their record high. The series dates back to 1966.
Also indicating marginal labor market improvement was the insured unemployment rate, which held at 5.0% versus the cycle high of 5.1%. The level remained more than double that of June 2008 and the highest since 1983. During the last ten years there has been a 93% correlation between the level of the insured unemployment rate and the overall rate of unemployment published by the Bureau of Labor Statistics.
Clearly, the latest weekly figure understates labor market distress in some states.The highest insured unemployment rates in the week ending June 6 were in Michigan (7.0 percent), Oregon (6.8), Puerto Rico (6.7), Nevada (6.3), Pennsylvania (6.2), Wisconsin (5.7), California (5.4), Arkansas (5.3), Illinois (5.3), and North Carolina (5.3).
The unemployment insurance claims data is available in Haver's WEEKLY database and the state data is in the REGIONW database.
| Unemployment Insurance (000s) | 06/20/09 | 06/13/09 | 06/06/09 | Y/Y | 2008 | 2007 | 2006 |
|---|---|---|---|---|---|---|---|
| Initial Claims | 627 | 612 | 605 | 59.9% | 420 | 321 | 313 |
| Continuing Claims | -- | 6,738 | 6,709 | 114.0% | 3,342 | 2,552 | 2,459 |

Tom Moeller
AuthorMore in Author Profile »Prior to joining Haver Analytics in 2000, Mr. Moeller worked as the Economist at Chancellor Capital Management from 1985 to 1999. There, he developed comprehensive economic forecasts and interpreted economic data for equity and fixed income portfolio managers. Also at Chancellor, Mr. Moeller worked as an equity analyst and was responsible for researching and rating companies in the economically sensitive automobile and housing industries for investment in Chancellor’s equity portfolio. Prior to joining Chancellor, Mr. Moeller was an Economist at Citibank from 1979 to 1984. He also analyzed pricing behavior in the metals industry for the Council on Wage and Price Stability in Washington, D.C. In 1999, Mr. Moeller received the award for most accurate forecast from the Forecasters' Club of New York. From 1990 to 1992 he was President of the New York Association for Business Economists. Mr. Moeller earned an M.B.A. in Finance from Fordham University, where he graduated in 1987. He holds a Bachelor of Arts in Economics from George Washington University.
More Economy in Brief


