 Global| Oct 24 2006
Decline in Chain Store Sales Retraced All of the Recent Gains
by:Tom Moeller
|in:Economy in Brief
Summary
Chain store sales dropped 1.1% last week and gave back all of the gains of the prior two periods, according to the International Council of Shopping Centers (ICSC)-UBS. The decline lowered the change in October sales to -0.4% versus [...]
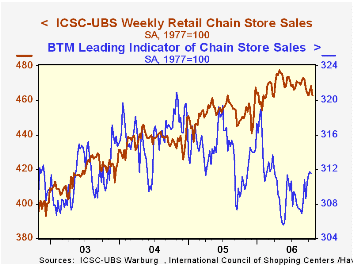
The ICSC-UBS retail chain-store sales index is constructed using the same-store sales (stores open for one year) reported by 78 stores of seven retailers: Dayton Hudson, Federated, Kmart, May, J.C. Penney, Sears and Wal-Mart.
The leading indicator of chain store sales from ICSC-UBS slipped 0.1% (+0.1% y/y) and reversed the prior week's increase.Taxation, Entrepreneurship, and Wealth from the Federal Reserve Bank of Chicago is available here
Pass-through of Exchange Rates to Consumption Prices: What Has Changed and Why from the Federal Reserve Bank of New York can be found here.
| ICSC-UBS (SA, 1977=100) | 10/21/06 | 10/14/06 | Y/Y | 2005 | 2004 | 2003 |
|---|---|---|---|---|---|---|
| Total Weekly Chain Store Sales | 462.9 | 468.1 | 2.9% | 3.6% | 4.7% | 2.9% |
by Tom Moeller October 24, 2006
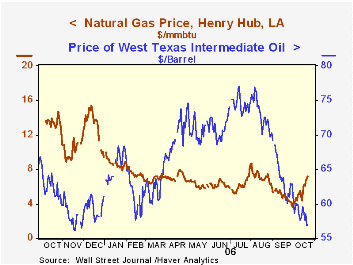 Natural gas prices have jumped during October as cold temperatures set in across the U.S. The latest reading found the Henry Hub price at $7.24 per mmbtu (-44.4% y/y) versus an average of $4.90 during September.
Making Sense of High Oil Prices from the Federal Reserve Bank of Dallas can be found here.
Natural gas prices have jumped during October as cold temperatures set in across the U.S. The latest reading found the Henry Hub price at $7.24 per mmbtu (-44.4% y/y) versus an average of $4.90 during September.
Making Sense of High Oil Prices from the Federal Reserve Bank of Dallas can be found here.
The latest Short-Term Energy Outlook from the U.S. Energy Information Administration is available here.
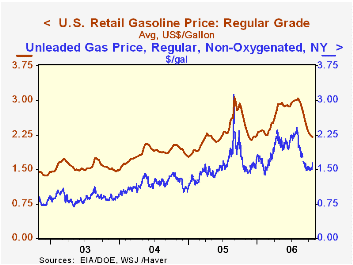
| Weekly Energy Prices | 10/23/06 | 10/16/06 | Y/Y | 2005 | 2004 | 2003 |
|---|---|---|---|---|---|---|
| US Retail Gasoline Price, Regular | $2.21 | $2.23 | -15.2% | $2.27 | $1.85 | $1.56 |
by Louise Curley October 24 , 2006
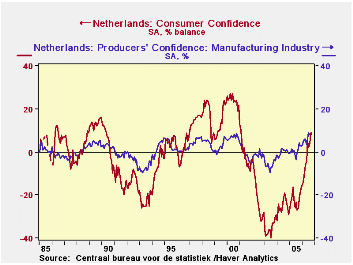
A collection of releases on confidence and consumer spending in Europe were released today. Producer confidence in the Netherlands increased in October while consumer confidence held steady. In Italy consumer confidence fell in October, and in France household consumption of manufactured goods dropped sharply in September after having risen equally sharply in August.
In the Netherlands, the excess of optimists over pessimists among producers rose to 9.0% in October from 7.9% in September and was 4.7 percentage points above October 2005. Although the excess of optimists seems rather small, it is the largest excess since the series began in January, 1985. Dutch producers have shown relatively low swings in confidence ranging from minus 9% to plus 9%. Dutch consumers, on the other hand, have experience much wider mood swings. Since January, 1985, the range of consumer confidence has been between plus twenty-nine and minus forty as can be see in the first chart that shows the entire history of the two series. Confidence among Dutch consumers in October was unchanged from September at 9%, but was 31 percentage points above October, 2005. This was the fifth month that the optimists outweighed the pessimists among Dutch consumers.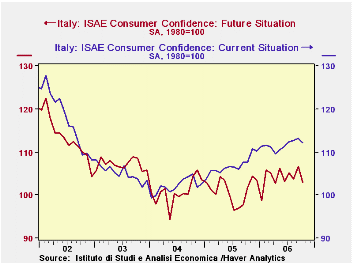
Italian consumer confidence fell 1.4% in October from September, but was 2.8% above October 2005. The Italian measure of confidence is expressed as an index with base 1980=100. Much of the decline in the overall indicator in October can be attributed to consumer concern for the future. In appraising the future situation, the October index fell 3.4% from 106.6 in September. In addition there was some loss of confidence in the current situation as evidenced in the decline of 0.8% in that index from September to October. The second chart compares consumers' appraisals of the current and future situations.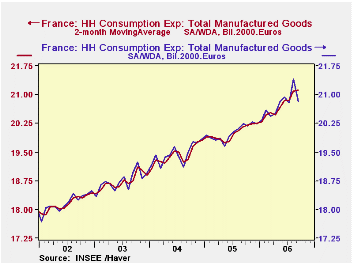
Finally, France's INSEE (Institute National de Statistique et Etude Economique) released data on what French households actually are spending on Manufactured Goods. Spending fell 2.69% from 21.040 billion 2000 euros in August to 20.8 billion 2000 euros in September, but August had shown big increase of 3.01% over July. If we take a two month moving average of the data, there is very little change from August to September, as can be seen in the third chart that compares the actual series with the two month moving average series.
| Oct 06 | Sep 06 | Oct 05 | M/M % | Y/Y % | 2005 | 2004 | 2003 | |
|---|---|---|---|---|---|---|---|---|
| NETHERLANDS | -- | -- | -- | -- | -- | -- | -- | -- |
| Consumer Confidence (% bal) |
9 | 9 | -22 | 0* | 3.1* | -22 | -25 | -35 |
| Producer Confidence (% bal) | 9.0 | 7.9 | 4.3 | 1.1* | 4.7* | .06 | -0.1 | -5.6 |
| ITALY | -- | -- | -- | -- | -- | -- | -- | -- |
| Consumer Confidence | 108.6 | 110.1 | 105.6 | -1.36 | 2.84 | 104.2 | 101.4 | 106.1 |
| Current Conditions | 112.2 | 113.1 | 107.6 | -0.80 | 4.28 | 106.9 | 102.1 | 105.1 |
| Future Conditions | 103.0 | 106.6 | 101.9 | -3.38 | 1.08 | 101.1 | 100.8 | 107.2 |
| FRANCE | Sep 06 | Aug 06 | Sep 05 | M/M % | Y/Y % | 2005 Mo Avg | 2004 Mo Avg | 2003 Mo Avg |
| HH Consumption of Mfg. Goods (Billion 2000 Euros) |
20.825 | 21.401 | 21.233 | -2.69 | 2.90 | 20.012 | 19.451 | 18.746 |
| Two Months Moving Avg. | 21.113 | 21.089 | 20.261 | -0.24 | 5.50 | 20.012 | 19.452 | 18.746 |

Tom Moeller
AuthorMore in Author Profile »Prior to joining Haver Analytics in 2000, Mr. Moeller worked as the Economist at Chancellor Capital Management from 1985 to 1999. There, he developed comprehensive economic forecasts and interpreted economic data for equity and fixed income portfolio managers. Also at Chancellor, Mr. Moeller worked as an equity analyst and was responsible for researching and rating companies in the economically sensitive automobile and housing industries for investment in Chancellor’s equity portfolio. Prior to joining Chancellor, Mr. Moeller was an Economist at Citibank from 1979 to 1984. He also analyzed pricing behavior in the metals industry for the Council on Wage and Price Stability in Washington, D.C. In 1999, Mr. Moeller received the award for most accurate forecast from the Forecasters' Club of New York. From 1990 to 1992 he was President of the New York Association for Business Economists. Mr. Moeller earned an M.B.A. in Finance from Fordham University, where he graduated in 1987. He holds a Bachelor of Arts in Economics from George Washington University.
More Economy in Brief


