 Global| Jun 30 2009
Decline In Case-Shiller Home PriceIndex Eases
by:Tom Moeller
|in:Economy in Brief
Summary
S&P/Case-Shiller Home Price Composite Index of twenty metro-markets slipped just 0.9% during April versus March. The latest monthly decline was the smallest since late 2007; however, it still left prices 18.1% lower during the last [...]
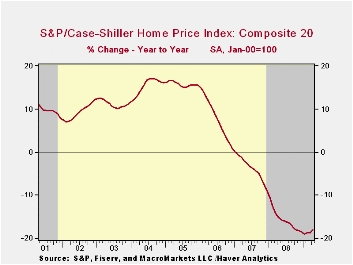
The series dates back only to 2001. The S&P/Case-Shiller home price series can be found in Haver's USECON database and the city data highlighted below is in the REGIONAL database.
 The
Case-Shiller index of 20 U.S. cities and their
surrounding areas is weighted to reflect price changes due to extensive
remodeling, home additions or extreme neglect. For example,
smaller weights are assigned to sales of homes that have undergone
extensive remodeling.
The
Case-Shiller index of 20 U.S. cities and their
surrounding areas is weighted to reflect price changes due to extensive
remodeling, home additions or extreme neglect. For example,
smaller weights are assigned to sales of homes that have undergone
extensive remodeling.
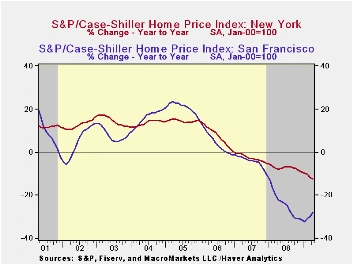
The Case-Shiller composite index of homes in 10 metropolitan areas, which has a longer history and dates back to 1987, also fell a lessened 1.0% and was down 18.0% year-to-year. The measure also was down by nearly one-third since the 2006 peak.· Less Weak Regions: In Cleveland, Ohio prices ticked up slightly m/m (-10.5% y/y) and in Dallas prices rose slightly as well (5.0% y/y). Prices also rose 0.7% in Denver (-4.9% y/y). In addition, in Boston the monthly decline in prices moderated substantially (-7.7% y/y) and in Chicago home prices were roughly unchanged m/m (-18.7% y/y). In New York, the price decline showed little moderation (12.5% y/y), off roughly 20% from their 2006 peak. In Charlotte, North Carolina prices also continued down moderately (10.0% y/y.
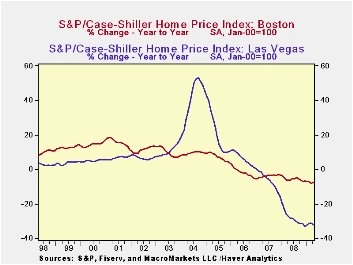 Weakest
Regions: Home prices in Phoenix, Nevada were quite weak and
fell 35.3% y/y and in San Francisco prices fell a lessened 28.0% y/y.
However, they still were off by nearly one-half from their early-2006
peak. Home prices in Las Vegas, Nevada continued their rapid rate of
decline, 32.1% y/y, and also were down by roughly one half from their
peak. The rate of price decline in Miami eased slightly (27.3% y/y
while home prices in Los Angeles continued to fall sharply 21.2% y/y.
In Tampa, the rate of monthly price decline slowed slightly (-21.3%
y/y). In Detroit, the monthly rate of price decline also eased
considerably (-25.4% y/y) but was off by early one-half from the
peak.
Weakest
Regions: Home prices in Phoenix, Nevada were quite weak and
fell 35.3% y/y and in San Francisco prices fell a lessened 28.0% y/y.
However, they still were off by nearly one-half from their early-2006
peak. Home prices in Las Vegas, Nevada continued their rapid rate of
decline, 32.1% y/y, and also were down by roughly one half from their
peak. The rate of price decline in Miami eased slightly (27.3% y/y
while home prices in Los Angeles continued to fall sharply 21.2% y/y.
In Tampa, the rate of monthly price decline slowed slightly (-21.3%
y/y). In Detroit, the monthly rate of price decline also eased
considerably (-25.4% y/y) but was off by early one-half from the
peak.
Here is a link to the latest press release from Standard & Poor's. An overview of the S&P/Case-Shiller home price series can be found here.
The history of the Case-Shiller data is available in Haver's USECON database.
| S&P/Case-Shiller Home Price Index (SA, Jan 00 = 100) | March | February | Y/Y | 2008 | 2007 | 2006 |
|---|---|---|---|---|---|---|
| 20 City Composite Index | 140.10 | 141.36 | -18.1% | -15.8% | -3.8% | 7.6% |
by Tom Moeller June 30, 2009
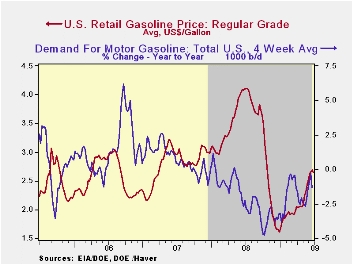
For all of last week, the energy markets continued to discount weakness in the economic environment. The likelihood of an easing in demand lowered the weekly average retail price for a gallon of regular gasoline slipped to $2.64 per gallon, down a nickel from the prior week. Yesterday, however, that decline stalled with heightened concerns regarding Mideast crude oil supplies. The Monday spot market price for a gallon of unleaded gasoline jumped roughly ten cents from last week's average to $1.90 per gallon. That jump did not, however, recover the price declines during prior weeks from the daily high of $2.04. The figures are reported by the U.S. Department of Energy and can be found in Haver's WEEKLY & DAILY databases.
The energy market's volatility was notably evident in crude
oil prices. The price for a barrel of West Texas Intermediate crude oil
jumped to $71.49 yesterday which was the highest level since the first
week of the month. Prices averaged $68.76 per barrel last week. Against
this backdrop crude oil production rose 3.6% y/y during the latest four
weeks. In addition, supplies of crude oil continue plentiful as
evidenced by a 13.3% y/y rise in inventories of crude oil &
petroleum products. The figures on crude oil production and inventories
are available in Haver's OILWKLY database.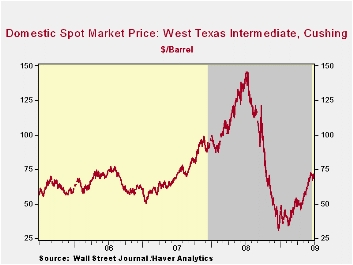
The gasoline demand figures continued to improve modestly but the comparisons still are negative. Year-to-year gasoline demand last week fell by 1.3%. That remained improved from the roughly 5.0% y/y decline of last fall. The change in demand is measured using the latest four weeks versus the same four weeks in 2008. Demand for all petroleum products was down 6.6% y/y in the latest week led by a 15.1% drop in distillate demand. These numbers also are available in Haver's OILWKLY database.
Finally, natural gas prices remained weak last week and fell to $3.86 per mmbtu (-70.0% y/y). Yesterday, natural gas prices held steady at $3.88 per mmbtu. Current prices are down by two-thirds from the high reached in early-July of $13.19/mmbtu.
Developing a Liquid Market for Inflation-Indexed Government Securities: Lessons from Earlier Experiences from the Federal Reserve Bank of St. Louis can be found here.
| Weekly Prices | 06/29/09 | 06/22/09 | Y/Y | 2008 | 2007 | 2006 |
|---|---|---|---|---|---|---|
| Retail Regular Gasoline ($ per Gallon, Regular) | 2.64 | 2.69 | -35.5% | 3.25 | 2.80 | 2.57 |
| Light Sweet Crude Oil, WTI ($ per bbl.) | 68.76 | 70.61 | -49.9% | 100.16 | 72.25 | 66.12 |
by Robert Brusca June 30, 2009
‘Official’ train wreck?? Maybe I shouldn’t
say ‘officially’ since no one in officialdom has really declared it so.
And I don’t want those with policies at Lloyds to come running for
remuneration because they are insured against injury inflicted by a
train gone amok. Still, the sharp downward revision to UK GDP is
stunning and it gives us a new take on reality.
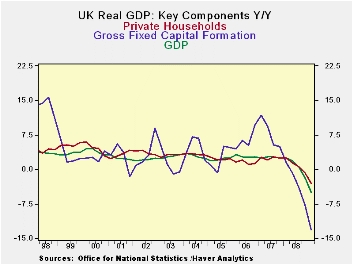
Capital spending takes a dive – If capital
spending were a prize-fighter, the boxing officials would be streaming
in for an investigation of such a sudden dive. UK capital spending in
Q1 ‘did in’ an already weak UK GDP showing in 2009-Q1 by falling at an
even steeper 27% annual rate. The annualized drop in UK GDP as a result
has sunk back to near double digit losses, showing a decline of at a
pace of 9.3% compared to -7.3% as last reported. And, yeah, they are
both bad numbers, but 9.3% is simply awful.
Bigger than a pot-hole: The GDP hole that
the UK must dig itself out of is deeper than we thought. And in this,
the UK is not alone. Not seasonally adjusted Irish GDP was revised
lower in Q1 to an annual rate drop of 8.5% from 7.5% previously.
Excluding its key international sector, Ireland’s GDP fell 12% in Q1.
Downward revisions have been an ongoing theme…
Yes we have no INFLATION!!! (for now) --
These sorts of downward revisions business activity help to explain
some of the other ‘news du jour’ such as the lowest inflation rate in
40 years in Italy (+0.5% Yr/Yr in June); the first-time-ever drop in
the EMU CPI (-0.1% in the twelve months ended in June); and, the lowest
inflation reading in at least 38 years for the OECD area (+0.1% Yr/Yr
in May).
Let’s do the twist...or let’s not -- There
has been some great twisting of inflation trends recently. As short a
time ago as July of 2008 OECD inflation had reached an 11-year high at
4.9% Yr/Yr; the plunge in the rate of inflation has a lot to do with
the global credit crisis and the deflating of the individual OECD
economies as well as the global economy. To the extent we may wish to
consider it a separate event, it also has to do with oil prices
falling. Energy prices in the OECD fell by 16.2% in the 12 months to
May obviously having a lot to do with the drop in that headline
inflation rate. That which twists can untwist…
The GDP-Gap trap - These huge hits to GDP
are behind us. The legacy of those hits is something economists call
the GDP-Gap. The Gap is the difference between where GDP is currently
compared to where it could have been had the economy grown at its
‘full-potential’. You get a good simple approximation of this by just
extending GDP’s growth trend before the economy slowed and fell and
looking at the resulting gap of that extrapolated line Vs actual GDP.
That gap will persist for some time into the future even if the economy
grows swiftly for several quarters.
The plot thickens - While no one expects
declines of the past order of magnitude to continue going forward,
there is considerable debate about the speed of the individual
economies and of the global economy. The turning point location for GDP
growth rates to become positive and the pace at which growth will
proceed once that happens are critical ingredients in the outlook for
inflation.
Risk source: Gap trap Vs central bankers at nap -
To Keynesian types these issues are the key; to others ‘the Gap’ is
still an issue that matters but monetarists look for the impact on
inflation to come from all the special reserve injections by various
central banks.
Market pricing, or groping - So the stage
is set. We can expect these issues to continue to be contentious as the
recession slows and recoveries re-start. Stock markets have rebounded
less on the expectation of strong GDP recovery growth rates and more on
the notion that huge drops in GDP are behind us and the companion
thought that at least some growth lies ahead. Bonds have been battered
back by those with fears of inflation from central-bank reserve growth
and the notion that the special times for distress pricing and the
flight to quality are behind us.
Markets will continue to toss and turn on these issues. Some
will revel in the existence of the GDP-Gap as a protector against
inflation. Others will dismiss it or diminish it. It is the wave of the
future.
| UK GDP | ||||||||
|---|---|---|---|---|---|---|---|---|
| Consumption | Capital Formation | Domestic | ||||||
| GDP | Private | Public | Total | Housing | Exports | Imports | Demand | |
| % change Q/Q | ||||||||
| Q1-09 | -9.3% | -5.0% | 0.9% | -26.9% | -41.5% | -25.0% | -24.1% | -9.5% |
| Q1-09 Previous | -7.3% | -4.7% | 1.2% | -14.2% | #N/A | -22.1% | -21.5% | -7.6% |
| Q4-08 | -7.0% | -4.3% | 4.3% | -4.7% | -12.7% | -15.6% | -20.2% | -8.7% |
| Q3-08 | -2.9% | -1.5% | 1.9% | -10.7% | -25.6% | -1.7% | -2.8% | -3.1% |
| Q2-08 | -0.2% | -1.5% | 4.0% | -8.8% | -21.9% | -1.8% | -5.3% | -1.2% |
| % change Yr/Yr | ||||||||
| Q1-09 | -4.9% | -3.1% | 2.8% | -13.2% | -26.2% | -11.6% | -13.6% | -5.7% |
| Q4-08 | -1.8% | -0.8% | 3.5% | -7.8% | -15.9% | -3.8% | -7.7% | -2.9% |
| Q3-08 | 0.5% | 0.7% | 2.6% | -3.9% | -14.8% | 0.5% | -1.7% | 0.1% |
| Q2-08 | 1.8% | 1.4% | 2.9% | -0.8% | -8.6% | 2.8% | 3.5% | 2.2% |
| 5-Yrs | 0.9% | 1.2% | 1.8% | 0.7% | -5.1% | 1.7% | 1.1% | 0.8% |
by Tom Moeller; June 30, 2009
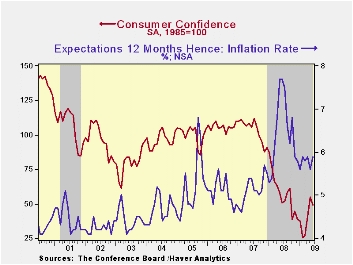
According to the Conference Board, consumer confidence slipped this month following gains during the prior three months. The slip did not, however, alter the picture of improvement in consumer attitudes. Confidence remained up by more than one-half from the February low and roughly equal to the year ago level. The Conference Board data can be found in Haver's CBDB database.
During the last ten years there has been an 86% correlation between the level of consumer confidence and the y/y change in real consumer spending.
The expectations component of confidence slipped the most last month with an 8.4% decline following three strong monthly increases. Still, the index remained near the highest level since late 2007. The percentage of respondents expecting business conditions to improve slipped to 21.2% but that remained near the highest level since 2004. A much reduced 20.2% expected conditions to worsen. That improvement was expected by 17.4 of respondents to generate more jobs, more than double the percentage at the recent low.
Consumers' assessment of the current economic conditions also
slipped m/m and remained near its recent low. It remained off by nearly
two-thirds from a year earlier. Jobs were seen as hard to get by a
still-high 44.8% of respondents and jobs were seen as plentiful by only
4.5% of respondents. Business conditions were seen as good by just 8.0%
and that was near the 1991 low. Consumers who thought business
conditions were bad rose slightly to 45.6%, still near the highest
since 1983.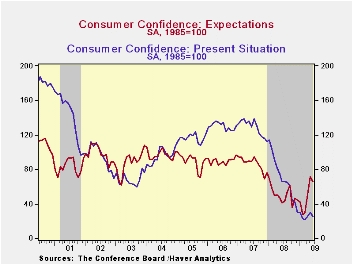
Expectations for the inflation rate in twelve months have been roughly stable at 5.9%. That's down from last year's high of 7.7%. Expectations about interest rates have increased sharply with 51.7% of respondents expecting higher rates while 16.3% expect rates to fall. A greatly increased 31.5% of respondents expected stock prices to rise.
| Conference Board (SA, 1985=100) | June | May | Y/Y % | 2008 | 2007 | 2006 |
|---|---|---|---|---|---|---|
| Consumer Confidence Index | 49.3 | 54.8 | -3.3 | 57.9 | 103.4 | 105.9 |
| Present Situation | 24.8 | 29.7 | -62.1 | 69.9 | 128.8 | 130.2 |
| Expectations | 65.5 | 71.5 | 58.2 | 50.0 | 86.4 | 89.7 |

Tom Moeller
AuthorMore in Author Profile »Prior to joining Haver Analytics in 2000, Mr. Moeller worked as the Economist at Chancellor Capital Management from 1985 to 1999. There, he developed comprehensive economic forecasts and interpreted economic data for equity and fixed income portfolio managers. Also at Chancellor, Mr. Moeller worked as an equity analyst and was responsible for researching and rating companies in the economically sensitive automobile and housing industries for investment in Chancellor’s equity portfolio. Prior to joining Chancellor, Mr. Moeller was an Economist at Citibank from 1979 to 1984. He also analyzed pricing behavior in the metals industry for the Council on Wage and Price Stability in Washington, D.C. In 1999, Mr. Moeller received the award for most accurate forecast from the Forecasters' Club of New York. From 1990 to 1992 he was President of the New York Association for Business Economists. Mr. Moeller earned an M.B.A. in Finance from Fordham University, where he graduated in 1987. He holds a Bachelor of Arts in Economics from George Washington University.
More Economy in Brief


