 Global| Mar 07 2006
Decline in 4Q U.S. Productivity Little Revised
by:Tom Moeller
|in:Economy in Brief
Summary
For 4Q '05, the decline in non-farm labor productivity was little revised at -0.5% versus the initial estimate of a 0.6% fall. It was the first decline in output per hour since 1Q '01 and followed an average gain of 3.7% during the [...]
For 4Q '05, the decline in non-farm labor productivity was little revised at -0.5% versus the initial estimate of a 0.6% fall. It was the first decline in output per hour since 1Q '01 and followed an average gain of 3.7% during the prior ten quarters. Consensus expectations had been for a slight upward revision to a 0.1% decline.
The initially reported slowdown in output growth which lowered productivity was moderated somewhat to 1.5% (3.7% y/y) from 4.7% during 3Q but hours worked rose slightly faster than initially estimated; 2.0% (1.2% y/y) versus a 0.4% 3Q rise.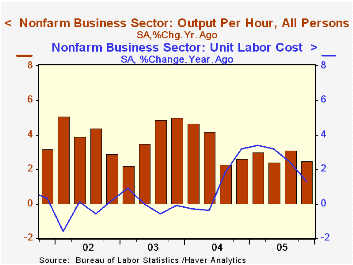
Growth in compensation costs was unrevised at 2.8% but the 5.5% rise during 3Q was upwardly revised. Unit labor cost growth of 3.3% was the quickest in a year though y/y growth of 1.3% represented an easing of cost pressures.
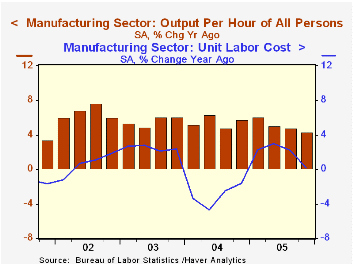
Factory sector productivity growth was revised upward to 4.7% (4.3% y/y) from 3.9% following a 3.7% gain during 3Q. Compensation growth of 1.8% (4.5% y/y) was little revised and unit labor costs in the factory sector fell 2.8% (0.2% y/y).
The implicit price deflator for the nonfarm business sector was revised slightly higher to 3.4% (3.1% y/y) from 3.2%.
Stop Paying More for Less: Ways to Boost Productivity in Higher Education from the Federal Reserve Bank of St. Louis can be found here.
| Non-farm Business Sector (SAAR) | 4Q '05 (Revised) | 4Q '05 (Prelim.) | 3Q '05 | Y/Y | 2005 | 2004 | 2003 |
|---|---|---|---|---|---|---|---|
| Output per Hour | -0.5% | -0.6% | 4.5% | 2.5% | 2.7% | 3.4% | 3.9% |
| Compensation per Hour | 2.8% | 2.8% | 5.5% | 3.8% | 5.4% | 4.5% | 4.0% |
| Unit Labor Costs | 3.3% | 3.5% | 1.2% | 1.3% | 2.6% | 1.1% | 0.0% |
by Tom Moeller March 7, 2006
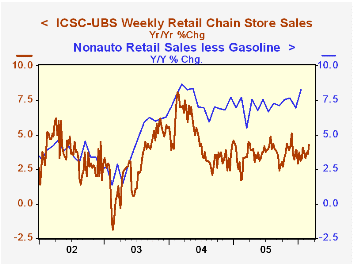
Chain store sales added 0.2% during the opening week of March to the 1.5% surge during the prior period, according to the International Council of Shopping Centers (ICSC)-UBS survey.
The gain lifted the level of sales in early March 1.4% above the February average which rose 1.1% from January.
During the last ten years there has been a 47% correlation between the y/y change in chain store sales and the change in nonauto retail sales less gasoline.
The leading indicator of chain store sales rose 0.3% late in February and the average level of the leading indicator fell 1.6% during the month.The ICSC-UBS retail chain-store sales index is constructed using the same-store sales (stores open for one year) reported by 78 stores of seven retailers: Dayton Hudson, Federated, Kmart, May, J.C. Penney, Sears and Wal-Mart.
| ICSC-UBS (SA, 1977=100) | 03/04/06 | 02/25/06 | Y/Y | 2005 | 2004 | 2003 |
|---|---|---|---|---|---|---|
| Total Weekly Chain Store Sales | 470.1 | 469.0 | 4.3% | 3.6% | 4.7% | 2.9% |
by Louise Curley March 7, 2006
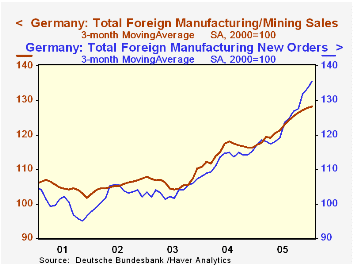
Foreign new orders for German manufactures rose 1.6% in January and were 16.2% above January, 2005. Even new orders from domestic sources, which were down slightly in January from December, were 5.7% above January, 2005. Year-to-year sales data were less dramatic, but still positive, with foreign sales 7.3% higher than January, 2005 and domestic sales, 0.9%. A breakdown of foreign orders between those from the Euro Zone and those from outside the Euro Zone is available from October, 2004 to date. In January, 2006, new orders from the Euro Zone declined 1.9% from December, but were 17.5% above January, 2005, Orders from countries outside the Euro Zone, rose 8.9% in January and were 15.1% above January, 2005.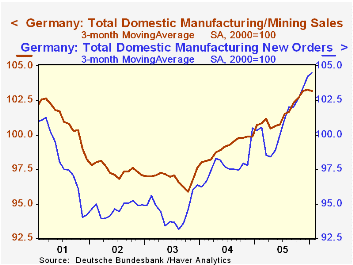
Because of the volatility in the sales and new order series, we have used three month moving averages to track longer term trends. The first chart shows the trend of new orders from, and sales to, foreign sources. New foreign orders have shown a particularly strong upward trend since early 2005. Currently, new foreign orders are running ahead of sales, suggesting there is support for continued increases in sales.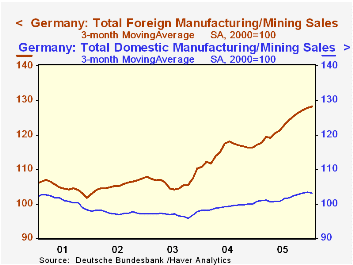
The same trends are evident in the case of domestic new orders and sales, as shown in the second chart. Both domestic new orders and domestic sales, however, still lag well behind foreign new orders and sales. The third chart compares domestic and foreign sales. On a three month average basis, domestic sales in January, 2006 were barely--1.2%--higher than the January 2001 average. On the same basis, foreign sales were up 21.3% over the same period.
| German New Orders and Sales (2000=100) | Jan 06 | Dec 05 | Jan 05 | M/M % | Y/Y % | 2005 | 2004 | 2003 |
|---|---|---|---|---|---|---|---|---|
| Total Sales | 112.9 | 112.9 | 109.0 | 0.00 | 3.58 | 110.1 | 105.5 | 100.7 |
| Domestic | 103.3 | 103.3 | 102.4 | 0.00 | 0.88 | 101.9 | 99.3 | 97.0 |
| Foreign | 128.4 | 128.4 | 119.7 | 0.00 | 7.29 | 123.5 | 115.6 | 106.7 |
| Total New Orders | 119.5 | 117.6 | 107.8 | 1.62 | 10.85 | 111.5 | 105.1 | 99.0 |
| Domestic | 104.6 | 104.8 | 99.0 | -0.19 | 5.66 | 101.2 | 98.3 | 94.6 |
| Foreign | 138.2 | 133.5 | 118.9 | 3.52 | 16.23 | 124.4 | 113.5 | 104.3 |
| Euro Zone | 136.9 | 139.5 | 116.5 | -1.86 | 17.51 | 120.3 | n.a. | n.a. |
| Non Euro Zone | 139.4 | 128.0 | 121.1 | 8.91 | 15.11 | 128.2 | n.a. | n.a. |

Tom Moeller
AuthorMore in Author Profile »Prior to joining Haver Analytics in 2000, Mr. Moeller worked as the Economist at Chancellor Capital Management from 1985 to 1999. There, he developed comprehensive economic forecasts and interpreted economic data for equity and fixed income portfolio managers. Also at Chancellor, Mr. Moeller worked as an equity analyst and was responsible for researching and rating companies in the economically sensitive automobile and housing industries for investment in Chancellor’s equity portfolio. Prior to joining Chancellor, Mr. Moeller was an Economist at Citibank from 1979 to 1984. He also analyzed pricing behavior in the metals industry for the Council on Wage and Price Stability in Washington, D.C. In 1999, Mr. Moeller received the award for most accurate forecast from the Forecasters' Club of New York. From 1990 to 1992 he was President of the New York Association for Business Economists. Mr. Moeller earned an M.B.A. in Finance from Fordham University, where he graduated in 1987. He holds a Bachelor of Arts in Economics from George Washington University.
More Economy in Brief


