 Global| Jan 25 2006
December Existing Home Sales Fell, 2006 Price Gain Weakest on Record
by:Tom Moeller
|in:Economy in Brief
Summary
Sales of existing homes fell 0.8% to 6.220M last month after two consecutive months of slight gain. Sales remained down 14.4% from the peak during June of 2005 and during all of last year sales fell 8.0% from the 2005 average. Sales [...]
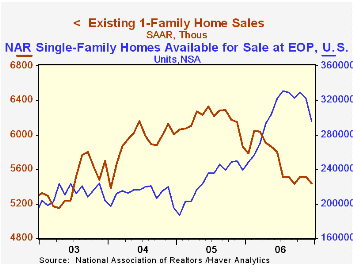
Sales of existing homes fell 0.8% to 6.220M last month after two consecutive months of slight gain. Sales remained down 14.4% from the peak during June of 2005 and during all of last year sales fell 8.0% from the 2005 average.
Sales of single family homes fell a sharper 1.3% last month after no change during November. Sales were 14.1% lower than during the peak month of June 2005 and sales fell 7.7% for the full year.
Existing single family home prices in December firmed 2.3% for after four consecutive months of decline. Prices remained down 4.0% from the peak this past July but for all of last year posted a 2.3% gain, the weakest on record.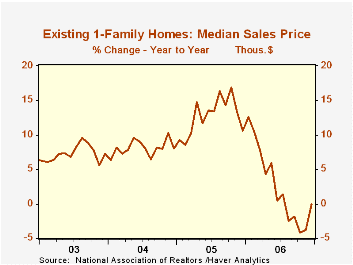
By region, single family home sales fell 1.3% (-2.5% y/y) in the Northeast and were off 5.9% for all of 2005. Out West sales dropped 9.9% (-14.8% y/y) in December but cratered 16.7% for the full year. Sales in the Midwest actually rose 3.2% (-5.1% y/y) in December but posted a 6.1% decline for 2006 and in the South sales ticked up 0.4% (-6.6% y/y), off 3.8% for the year.
The inventory of "homes on the market" dropped a sharp 7.9% (+23.3% y/y) in December, the fourth decline in the last five month. At current sales rates, the inventory of homes for sale amounts to 6.8 months, down from the 7.4 month peak in October.
The broad aggregate data on existing home sales are included in Haver's USECON database; details about prices by region and inventories are available in the REALTOR database.
| Existing Home Sales (SAAR, 000s) | December | November | Y/Y | 2006 | 2005 | 2004 |
|---|---|---|---|---|---|---|
| Total Sales | 6,220 | 6,270 | -7.9% | 6,500 | 7,064 | 6,722 |
| Single-Family Sales | 5,440 | 5,510 | -7.2% | 5,697 | 6,170 | 5,912 |
| Median Single-Family Home Price (NSA,000s) | $221.6 | $216.7 | 0.0% | $222.4 | $217.5 | $192.8 |
by Tom Moeller January 25, 2007

The Conference Board reported that its Index of Help-Wanted Advertising in December popped upwards to 33, its highest level since June.
During the last ten years there has been a 57% correlation between the level of help-wanted advertising and the three month change in non-farm payrolls.
The proportion of labor markets with rising want-ad volume also surged to 77%, the highest level since July of 2005.
The Conference Board surveys help-wanted advertising volume in 51 major newspapers across the country every month.
The latest help wanted report from the Conference Board is available here.
| Conference Board | December | November | December '05 |
|---|---|---|---|
| National Help Wanted Index | 33 | 29 | 38 |
by Tom Moeller January 25, 2007
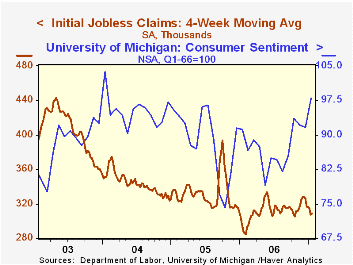
Initial unemployment insurance claims jumped 36,000 to 325,000 last week and reversed all of the declines over the prior two weeks. Consensus expectations had been for a lesser increase to 310,000.
During the last ten years there has been a (negative) 77% correlation between the level of initial claims and the m/m change in nonfarm payroll employment.
The four-week moving average of initial claims increased modestly to 309,250 (7.1% y/y). 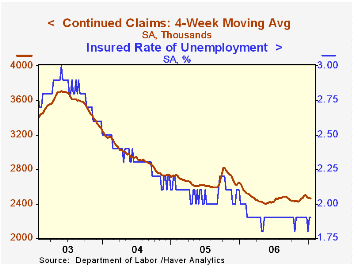
Continuing claims for unemployment insurance fell 39,000 and reversed part of the prior week's 113,000 surge.
The insured rate of unemployment remained at 1.9%, about where it's been since February.
The Budget & Economic Outlook: Fiscal Years 2007 to 2016 from the Congressional Budget Office can be found here.
| Unemployment Insurance (000s) | 01/20/07 | 01/13/07 | Y/Y | 2006 | 2005 | 2004 |
|---|---|---|---|---|---|---|
| Initial Claims | 325 | 289 | 15.7% | 313 | 332 | 343 |
| Continuing Claims | -- | 2,484 | -3.2% | 2,459 | 2,662 | 2,924 |
by Carol Stone January 25, 2007
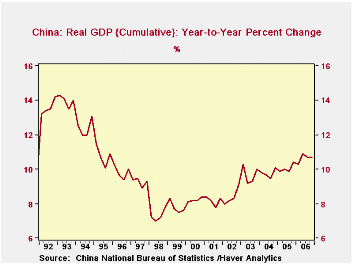
China's economy continued to expand rapidly in Q4, according to GDP data reported today (Jan 25). The Q4 GDP was 10.4% above that for Q4 2005, making the whole year 10.7% above 2005. This was the strongest yearly performance since 1995.
China, of course, has become the world's manufacturing center, and it is that industrial sector that drove the further acceleration in the annual outcome. This is called secondary industry by the Chinese national accounts compilers; the product of that segment expanded by 12.5% in the year, about the same as 12.7% in 2003, and otherwise the largest growth since 1995. The secondary industries are manufacturing, mining, utilities and construction. Primary industries, which include agriculture, forestry and fishing, expanded 5.0%, and tertiary industries, basically the service sector, grew 10.3%, about in line with the last seven or eight years' gains. 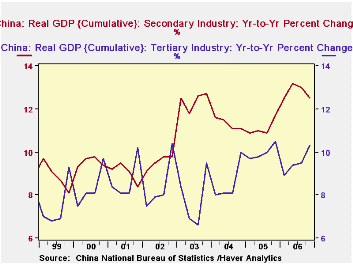
While these data are "provisional" according to China's National Bureau of Statistics, they do contain a hint of slowing in the key secondary industry sector. Its gross product had been up as much as 13.2% in Q2, year-to-date over the comparable year-ago period. So there has apparently been moderate easing through the second half of the year to the cumulative total of 12.5%. This is also apparent in monthly data on industrial production. Year-on-year growth rates in the autumn months had decreased to 14-3/4% from 18% in the spring. This of course still shows dramatic strength -- which indeed may elicit interest rate increases from the Central Bank -- but the less ebullient performance does suggest that there may be some capacity limits on Chinese activity. We could guess they are at least partially energy-related.
| CHINA | Q4 2006 | Q3 2006 | Q2 2006 | Year Ago | 2006 | 2005 | 2004 |
|---|---|---|---|---|---|---|---|
| Real GDP: Yr/Yr % Change | 10.4 | 10.6 | 11.5 | 9.9 | 10.7 | 9.9 | 9.5 |
| Year-to-Date % Change | 10.7 | 10.7 | 10.9 | 10.4 | 10.7 | 10.4 | 10.1 |
| Primary Industries | 5.0 | 4.9 | 5.1 | 5.2 | 5.0 | 5.2 | 6.3 |
| Secondary Industries | 12.5 | 13.0 | 13.2 | 11.7 | 12.5 | 11.7 | 11.1 |
| Tertiary Industries | 10.3 | 9.5 | 9.4 | 10.5 | 10.3 | 10.5 | 10.0 |
| Nominal GDP: Bil.Yuan | 5,659.6 | 5,129.3 | 5,024.1 | 4,820.0 | 20,834.0 | 18,232.1 | 15,987.0 |
| Bil.US$ | 719.9 | 644.0 | 627.2 | 596.3 | 2,614.7 | 2,226.1 | 1,931.6 |

Tom Moeller
AuthorMore in Author Profile »Prior to joining Haver Analytics in 2000, Mr. Moeller worked as the Economist at Chancellor Capital Management from 1985 to 1999. There, he developed comprehensive economic forecasts and interpreted economic data for equity and fixed income portfolio managers. Also at Chancellor, Mr. Moeller worked as an equity analyst and was responsible for researching and rating companies in the economically sensitive automobile and housing industries for investment in Chancellor’s equity portfolio. Prior to joining Chancellor, Mr. Moeller was an Economist at Citibank from 1979 to 1984. He also analyzed pricing behavior in the metals industry for the Council on Wage and Price Stability in Washington, D.C. In 1999, Mr. Moeller received the award for most accurate forecast from the Forecasters' Club of New York. From 1990 to 1992 he was President of the New York Association for Business Economists. Mr. Moeller earned an M.B.A. in Finance from Fordham University, where he graduated in 1987. He holds a Bachelor of Arts in Economics from George Washington University.
More Economy in Brief


