 Global| Dec 17 2002
CPI Weak, As Expected
by:Tom Moeller
|in:Economy in Brief
Summary
The Consumer Price Index (CPI-U) rose just 0.1% last month. The gain was as expected. Excluding food and energy, prices also rose as expected and the rise was equal to the YTD average. Tobacco prices (-0.0%) fell for the second [...]
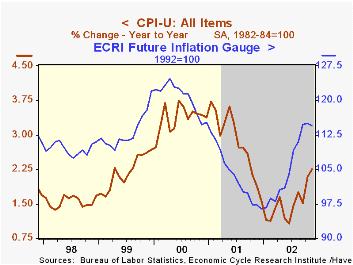
The Consumer Price Index (CPI-U) rose just 0.1% last month. The gain was as expected. Excluding food and energy, prices also rose as expected and the rise was equal to the YTD average.
Tobacco prices (-0.0%) fell for the second consecutive month. The core CPI less tobacco rose 0.2% (2.0% y/y).
Price discounting was widespread last month. Household furnishings and operation prices fell 0.1%, the sixth monthly decline this year. Apparel prices also fell (-0.4%) after being unchanged the month prior. New and used vehicle prices were down for the second consecutive month.
Services prices were mixed. Shelter prices rose 0.3% following the 0.2% gain in the prior month. Public transportation prices rose 0.9% following two months of decline. Medical care services prices rose 0.6%, just below the elevated October reading. Education prices were flat for the second month. Recreation prices were flat for the second month in three.
Energy prices fell last month led by a 0.2% decline in gasoline prices, the first since May. Fuel and utility prices were unchanged owing to a decline in piped gas & electricity prices
For analysis of health care costs and coverage by the St. Louis Federal Reserve click here.
| Consumer Price Index | Nov | Oct | Y/Y | 2001 | 2000 | 1999 |
|---|---|---|---|---|---|---|
| Total | 0.1% | 0.3% | 2.3% | 2.8% | 3.4% | 2.2% |
| Total less Food & Energy | 0.2% | 0.2% | 2.0% | 2.7% | 2.4% | 2.1% |
| Goods less Food & Energy | -0.3% | -0.1% | -1.6% | 0.3% | 0.5% | 0.7% |
| Services less Energy | 0.3% | 0.3% | 3.5% | 3.7% | 3.3% | 2.7% |
| Energy | -0.2% | 1.9% | 8.1% | 3.7% | 16.9% | 3.6% |
| Food & Beverages | 0.2% | 0.1% | 1.2% | 3.1% | 2.3% | 2.1% |
| Chained CPI: Total (NSA) | -0.1% | 0.2% | 1.9% | 2.1% | 2.0% | NA |
| Total less Food & Energy | 0.0% | 0.2% | 1.5% | 1.9% | 1.4% | NA |
by Tom Moeller December 17, 2002
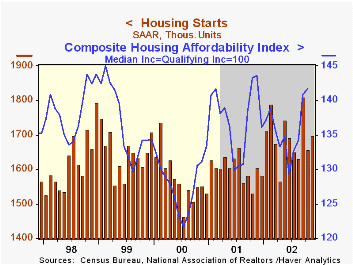
Housing starts rose slightly more than expected last month. The 2.4% m/m rise partially recouped an 8.4% October decline that was revised slightly shallower. Total starts were up 7.2% versus last December.
Single family starts rose a modest 0.9% m/m following a 5.1% October decline. Year to date, single family starts were up 7.4% versus last December.
Multi-family starts rose 10.0% following two months of sharp decline. Year to date, multi family starts were up 6.2% versus last December.
Building permits reversed all of the prior month's gain and fell 2.7% m/m. The decline was all due to lower multi family permits. Single family permits rose a slight 0.1% following three months of strong gain. The level of single family permits was near the record high of this past February.
| Housing Starts (000s, AR) | Nov | Oct | Y/Y | 2001 | 2000 | 1999 |
|---|---|---|---|---|---|---|
| Total | 1,697 | 1,657 | 5.8% | 1,603 | 1,573 | 1,647 |
| Single Family | 1,390 | 1,378 | 12.0% | 1,273 | 1,232 | 1,306 |
| Multi Family | 307 | 279 | -15.4% | 330 | 341 | 341 |
by Tom Moeller December 17, 2002
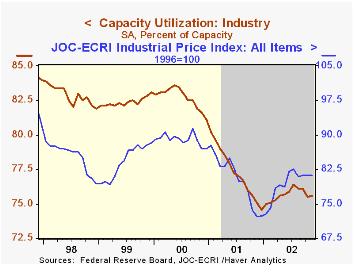
Industrial production rose just slightly last month versus Consensus expectations for a 0.2% gain. It was the first monthly rise in output since July. October's decline was lessened and prior month's figures were revised up. Production was up 2.5% (AR) year to date.
Output in the manufacturing sector rose 0.1% following two months of decline. Factory production was up 2.3% (AR) year to date.
Output of motor vehicles and parts (5.2% AR, YTD) rose 3.9% for the first gain in four months. Output of appliance, furniture & carpeting rose 0.8%, but it was only the second monthly rise since May. Apparel output rose 0.4% but was down 4.2% (AR) year to date.
Output of business equipment fell 0.5% (-3.0% AR, YTD), the fourth decline in five months. Output of information processing equipment rose for the second consecutive month (-1.1% AR, YTD).
Capacity utilization rose slightly and is off the lows of late last year, but remains down considerably from prior years. Capacity again rose 0.1%(1.1% AR, YTD) as it has since early last year.
| Production & Capacity | Nov | Oct | Y/Y | 2001 | 2000 | 1999 |
|---|---|---|---|---|---|---|
| Industrial Production | 0.1% | -0.6% | 1.8% | -3.5% | 4.7% | 4.3% |
| Capacity Utilization | 75.6% | 75.5% | 75.1%(11/01) | 77.3% | 82.7% | 82.4% |
by Tom Moeller December 17, 2002
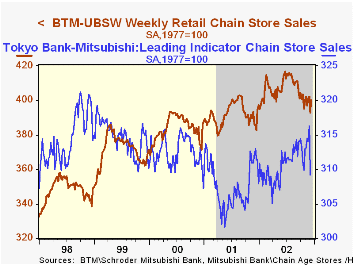
Chain store sales surged 1.9% last week according to the BTM-UBSW survey. The gain recovered most, but not all, of the prior week's 2.3% plunge.
Since early October, weekly sales have been volatile but essentially have moved sideways.
December sales so far were 1.0% below the November average.
The BTM Leading Indicator of chain store sales collapsed in early December and was 1.6% (-1.2% y/y) below November.
During the last ten years there has been a 48% correlation between the year-to-year percent change in monthly chain store sales and the change in GAF retail sales. That correlation rose to 63% during the last five years.
| BTM-UBSW (SA, 1977=100) | 12/14/02 | 12/07/02 | Y/Y | 2001 | 2000 | 1999 |
|---|---|---|---|---|---|---|
| Total Weekly Retail Chain Store Sales | 400.1 | 392.8 | 4.5% | 2.1% | 3.4% | 6.7% |
by Tom Moeller December 17, 2002
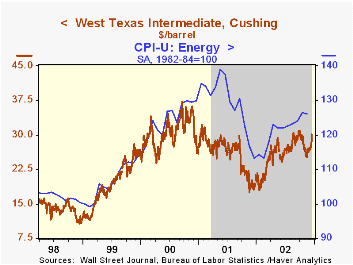
Prices have surged $5.00/bbl for West Texas Intermediate crude oil since the mid-November lows. A labor strike in Venezuela has crippled the country's oil output.
Wholesale gasoline prices have similarly surged, rising nearly $0.15 per gallon, or 19%, since late November. Fuel oil prices also have risen sharply.
Wholesale natural gas prices have more than doubled this year.
| Daily Crude Oil Prices | 12/16/02 | 11/18/02 | Y/Y | 2001 | 2000 | 1999 |
|---|---|---|---|---|---|---|
| West Texas Intermediate Crude Oil | $30.13 | $26.73 | 56.7% | $25.97 | $30.34 | $19.34 |

Tom Moeller
AuthorMore in Author Profile »Prior to joining Haver Analytics in 2000, Mr. Moeller worked as the Economist at Chancellor Capital Management from 1985 to 1999. There, he developed comprehensive economic forecasts and interpreted economic data for equity and fixed income portfolio managers. Also at Chancellor, Mr. Moeller worked as an equity analyst and was responsible for researching and rating companies in the economically sensitive automobile and housing industries for investment in Chancellor’s equity portfolio. Prior to joining Chancellor, Mr. Moeller was an Economist at Citibank from 1979 to 1984. He also analyzed pricing behavior in the metals industry for the Council on Wage and Price Stability in Washington, D.C. In 1999, Mr. Moeller received the award for most accurate forecast from the Forecasters' Club of New York. From 1990 to 1992 he was President of the New York Association for Business Economists. Mr. Moeller earned an M.B.A. in Finance from Fordham University, where he graduated in 1987. He holds a Bachelor of Arts in Economics from George Washington University.
More Economy in Brief


