 Global| Sep 16 2003
CPI Up Less Than Expected
by:Tom Moeller
|in:Economy in Brief
Summary
The Consumer Price Index (CPI-U) rose 0.3% in August versus the Consensus expectation for a 0.4% gain. A weaker than expected gain in "core" prices accounted for the relatively tame report. The 0.1% rise in the CPI less food & energy [...]
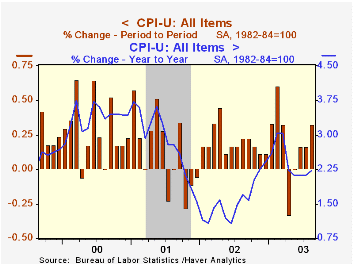
The Consumer Price Index (CPI-U) rose 0.3% in August versus the Consensus expectation for a 0.4% gain.
A weaker than expected gain in "core" prices accounted for the relatively tame report. The 0.1% rise in the CPI less food & energy was less than Consensus expectations for a 0.2% increase. This weakness came despite a 0.6% (-1.3% y/y) gain in tobacco prices which followed the 1.3% July jump.
Prices of consumer goods continued to deflate. Prices for new and used vehicles fell 0.2% (-2.7% y/y) and prices for household furnishings & operation dropped 0.3% (-2.0% y/y). Apparel prices rose modestly for the third straight month but nevertheless fell 2.7% y/y.
Core services prices rose just 0.2%, the average of the last three months. Shelter prices rose 0.2% (2.3% y/y) and medical care services prices also rose just 0.2% (4.2% y/y).Public transportation prices fell for the first month since February (2.2 y/y).Education & communication prices surged 0.5% (1.1% y/y) for the second month.
Energy prices jumped 2.7% as gasoline prices surged 6.2% (14.5% y/y). Gasoline prices are up another 6.2% so far in September. Fuel oil prices rose 1.2% (16.7% y/y) though piped gas & electricity prices fell for the second consecutive month (9.4% y/y).
The chained CPI which adjusts for shifts in consumer buying behavior rose 0.3% m/m but is unchanged since March. It is similar to the PCE price deflator. The core price measure was unchanged.
Analysis from the Federal Reserve Bank of San Francisco titled "Improving the Way We Measure Consumer Prices" can be found here.
The paper "Inflation Scares and Forecast-Based Monetary Policy" can be found in the Federal Reserve Board's Finance and Economics Discussion Series.
| Consumer Price Index | Aug | July | Y/Y | 2002 | 2001 | 2000 |
|---|---|---|---|---|---|---|
| Total | 0.3% | 0.2% | 2.2% | 1.6% | 2.8% | 3.4% |
| Total less Food & Energy | 0.1% | 0.2% | 1.3% | 2.3% | 2.7% | 2.4% |
| Goods less Food & Energy | -0.1% | -0.1% | -2.2% | -1.1% | 0.3% | 0.5% |
| Services less Energy | 0.2% | 0.3% | 2.7% | 3.8% | 3.7% | 3.3% |
| Energy | 2.7% | 0.4% | 11.9% | -5.8% | 3.7% | 16.9% |
| Food & Beverages | 0.3% | 0.1% | 2.5% | 1.8% | 3.1% | 2.3% |
| Chained CPI: Total (NSA) | 0.3% | 0.0% | 1.7% | 1.3% | 2.3% | 2.0% |
| Total less Food & Energy | 0.0% | 0.1% | 0.8% | 1.8% | 2.0% | 1.4% |
by Tom Moeller September 16, 2003
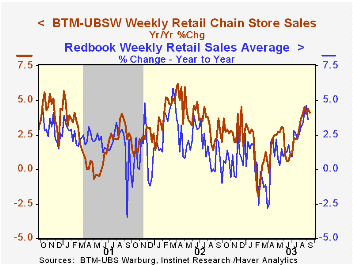
Chain store sales last week gave back 0.3% of the prior week's 0.5% rise according to the BTM-UBSW survey.
So far in September sales are 0.3% ahead of the August average which rose 0.9% from July.
During the last five years there has been a 62% correlation between the year-to-year percent change in chain store sales and the change in non-auto retail sales less gasoline.
The BTM-UBSW retail chain-store sales index is constructed from the sales results reported by seven retailers: Dayton Hudson, Federated, Kmart, May, J.C. Penney, Sears and Wal-Mart.
| BTM-UBSW (SA, 1977=100) | 9/13/03 | 9/06/03 | Y/Y | 2002 | 2001 | 2000 |
|---|---|---|---|---|---|---|
| Total Weekly Retail Chain Store Sales | 428.0 | 429.4 | 4.1% | 3.6% | 2.1% | 3.4% |
by Tom Moeller September 16, 2003
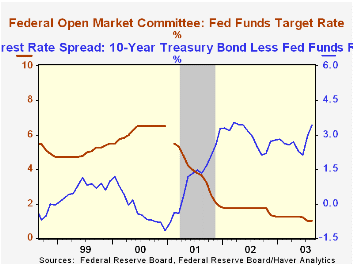
The Federal Reserve left the target rate for federal funds unchanged at 1.00%. The discount rate also was left unchanged at 2.00%.
The unanimous action was as expected by economists.
The press release which accompanied the Fed’s action contained the following statement. "The Committee continues to believe that an accommodative stance of monetary policy, coupled with robust underlying growth in productivity, is providing important ongoing support to economic activity. The evidence accumulated over the intermeeting period confirms that spending is firming, although the labor market has been weakening. Business pricing power and increases in core consumer prices remain muted."
The complete text of the Fed's latest press release could be found here.
U.S. Manpower Hiring Index Improvedby Tom Moeller September 16, 2003
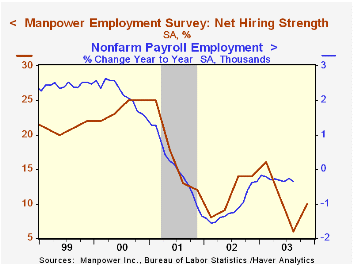
The Manpower employment survey for 4Q03 improved versus 3Q. A seasonally adjusted net 10% of 16,000 employers expect to increase hiring activity.
The latest reading is up from 6% in 3Q but was still slightly below the average for this year.
Since 1980 there has been a 75% correlation between the Manpower index and the y/y change in nonfarm payrolls.
The latest press release from Manpower Inc. covering employment prospects in 18 countries can be viewed here.
| Manpower Employment Survey | 4Q03 | 3Q03 | 4Q02 | 2003 | 2002 | 2001 |
|---|---|---|---|---|---|---|
| All Industries - Net Higher (SA) | 10 | 6 | 14 | 11 | 11 | 17 |
by Tom Moeller September 16, 2003
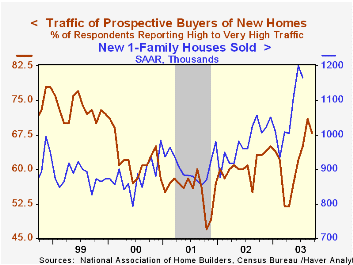
The National Association of Home Builders (NAHB) reported that their Composite Housing Market Index fell this month. Nevertheless, the index at 68, up 7.9% y/y, was at the second highest level since early 2000.
During the last fifteen years there has been a 68% correlation between the y/y change in the NAHB index and the change in new home sales.
The index of current market conditions for home sales fell to 73 (9.0% y/y).
The index which measures expected home sales in six months was unchanged at 78 (8.3% y/y) versus an average of 69 during all of last year.
Traffic of prospective buyers fell slightly but for the quarter was at the highest level since 3Q99.
The NAHB index is a diffusion index based on a survey of builders. Readings above 50 signal that more builders view conditions as good than poor.
Visit the National Association of Home Builders using this link.
| Nat'l Association of Home Builders | Sept | Aug | Y/Y | 2002 | 2001 | 2000 |
|---|---|---|---|---|---|---|
| Composite Housing Market Index | 68 | 71 | 63 | 61 | 56 | 62 |

Tom Moeller
AuthorMore in Author Profile »Prior to joining Haver Analytics in 2000, Mr. Moeller worked as the Economist at Chancellor Capital Management from 1985 to 1999. There, he developed comprehensive economic forecasts and interpreted economic data for equity and fixed income portfolio managers. Also at Chancellor, Mr. Moeller worked as an equity analyst and was responsible for researching and rating companies in the economically sensitive automobile and housing industries for investment in Chancellor’s equity portfolio. Prior to joining Chancellor, Mr. Moeller was an Economist at Citibank from 1979 to 1984. He also analyzed pricing behavior in the metals industry for the Council on Wage and Price Stability in Washington, D.C. In 1999, Mr. Moeller received the award for most accurate forecast from the Forecasters' Club of New York. From 1990 to 1992 he was President of the New York Association for Business Economists. Mr. Moeller earned an M.B.A. in Finance from Fordham University, where he graduated in 1987. He holds a Bachelor of Arts in Economics from George Washington University.
More Economy in Brief


