 Global| Aug 15 2003
CPI Up As Expected
by:Tom Moeller
|in:Economy in Brief
Summary
The Consumer Price Index (CPI-U) rose an expected 0.2% in July following a like increase in June. The CPI less food and energy also rose 0.2%. That rise was stronger than Consensus expectations for a 0.1% increase. A 1.2% jump in [...]
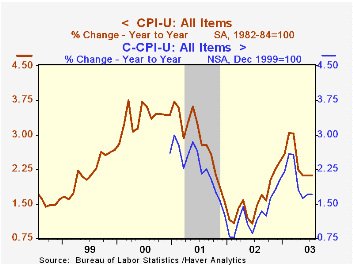
The Consumer Price Index (CPI-U) rose an expected 0.2% in July following a like increase in June.
The CPI less food and energy also rose 0.2%. That rise was stronger than Consensus expectations for a 0.1% increase. A 1.2% jump in tobacco prices and an uptick in services prices accounted for the surprise.
Continued deflation in the goods sector was led by lower prices for new and used vehicles (-2.3% y/y) and lower prices for household furnishings and operation (-1.9% y/y). Apparel prices were unchanged m/m but still are down 2.0% y/y.
Core services prices managed a moderate 0.3% gain following the weak 0.1% rise in June. Education and communication prices surged 0.5% (1.3% y/y) following four consecutive months of decline. A sharper increase in August may follow warned the Bureau of Labor Statistics. Shelter prices recovered 0.3% (2.4% y/y) versus the slight June decline. Medical care services prices rose 0.4% for the second month (4.3% y/y).Public transportation prices were strong, rising for the fifth straight month (3.3 y/y).
Energy prices increased moderately. Gasoline prices, up 1.2%, were strong for the second month and they have risen by more than double that degree so far in August. Fuel oil prices recovered 1.0% following three months of decline.
The chained CPI which adjusts for shifts in consumer buying behavior was unchanged m/m and during the last four months has fallen 0.3%. It is similar to the PCE price deflator. The core price measure rose 0.1% after the 0.2% drop in June.
Analysis from the Federal Reserve Bank of St. Louis titled "Deflation, Corrosive and Otherwise" can be found here.
| Consumer Price Index | July | June | Y/Y | 2002 | 2001 | 2000 |
|---|---|---|---|---|---|---|
| Total | 0.2% | 0.2% | 2.1% | 1.6% | 2.8% | 3.4% |
| Total less Food & Energy | 0.2% | 0.0% | 1.5% | 2.3% | 2.7% | 2.4% |
| Goods less Food & Energy | -0.1% | -0.1% | -1.8% | -1.1% | 0.3% | 0.5% |
| Services less Energy | 0.3% | 0.1% | 2.9% | 3.8% | 3.7% | 3.3% |
| Energy | 0.4% | 0.8% | 9.1% | -5.8% | 3.7% | 16.9% |
| Food & Beverages | 0.1% | 0.4% | 2.1% | 1.8% | 3.1% | 2.3% |
| Chained CPI: Total (NSA) | 0.0% | 0.1% | 1.7% | 1.3% | 2.3% | 2.0% |
| Total less Food & Energy | 0.1% | -0.2% | 1.0% | 1.8% | 2.0% | 1.4% |
by Tom Moeller August 15, 2003
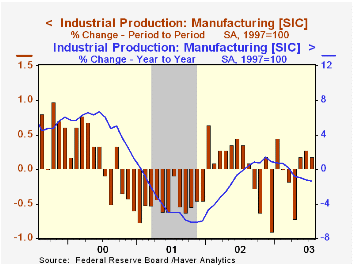
Industrial production in July rose more than Consensus expectations for a 0.2% gain. The 0.5% gain was boosted by a 3.8% surge in utility output which was only the second m/m increase since February. Modest May & June gains in total output were revised down.
Output in the manufacturing sector rose a modest 0.2% (-1.3% y/y). The previously reported 0.5% surge in June was revised lower to 0.3%.
Output in selected high-technology industries rose strongly last month as it has all year. The 0.8% (9.3% y/y) gain was powered by a 1.6% (21.9% y/y) surge in computers and peripheral equipment output. Output of semiconductors and related equipment (15.9% y/y) also has been strong.
Excluding high-tech, factory output rose 0.1% (-2.0% y/y) in July. Motor vehicle output jumped 2.9% (-0.9% y/y) output of electrical equipment and appliances sagged 0.7% (-3.8% y/y). Output of furniture rose 2.3% (-2.3% y/y) but a 1.0% June gain was revised to a 0.8% decline. Output of nondurable goods fell 0.4% (-3.0% y/y)
Total capacity utilization rose slightly to 74.5%. Factory sector utilization rose to 72.8%. Growth in capacity remained slow at 1.1% y/y versus 1.5% growth last year and 3.2% growth in 2001. Growth in factory sector capacity has been an even slower 0.7% y/y versus 1.3% growth last year.
The influence of trend output growth on the US economy's "speed limit" is discussed by the Federal Reserve Bank of San Francisco here.
| Production & Capacity | July | June | Y/Y | 2002 | 2001 | 2000 |
|---|---|---|---|---|---|---|
| Industrial Production | 0.5% | 0.0% | -1.4% | -0.8% | -3.5% | 4.7% |
| Capacity Utilization | 74.5% | 74.2% | 76.4%(7/02) | 75.6% | 77.3% | 82.7% |
by Tom Moeller August 15, 2003
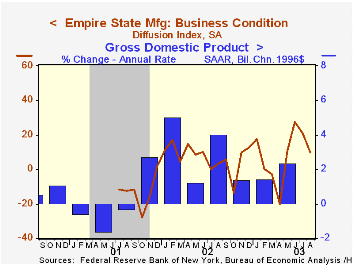
The Empire State Index of General Business Conditions fell unexpectedly for August. The NY Fed's Manufacturing Survey indicated that the index fell to 9.98 this month versus Consensus expectations for a reading of 20.0.
Declines in the inventory and in the unfilled orders indexes may have accounted for much of the lower overall index. New orders fell just moderately while shipments and employment improved, the latter meaningfully.
The index of prices paid fell to a low 4.08. That's less than half the average reading so far this year.
The survey includes measures of business expectations six months ahead. This diffusion index improved substantially to 59.47 though expectations for capital expenditures fell.
The Empire State Manufacturing Survey is a monthly survey of manufacturers in New York State conducted by the Federal Reserve Bank of New York. Participants from across the state in a variety of industries respond to a questionnaire and report the change in a variety of indicators from the previous month. Respondents also state the likely direction of these same indicators six months ahead. April 2002 is the first report, although survey data date back to July 2001.
Like the Philadelphia Fed Index of General Business Conditions, the Empire State Business Conditions Index reflects answers to an independent survey question, not the components.
For the latest Empire State Manufacturing Survey report, click here.
| Empire State Manufacturing Survey | August | July | Y/Y | 2002 | 2001 |
|---|---|---|---|---|---|
| General business conditions (diffusion index) | 9.98 | 20.83 | 3.41 | 7.10 | -13.02 |

Tom Moeller
AuthorMore in Author Profile »Prior to joining Haver Analytics in 2000, Mr. Moeller worked as the Economist at Chancellor Capital Management from 1985 to 1999. There, he developed comprehensive economic forecasts and interpreted economic data for equity and fixed income portfolio managers. Also at Chancellor, Mr. Moeller worked as an equity analyst and was responsible for researching and rating companies in the economically sensitive automobile and housing industries for investment in Chancellor’s equity portfolio. Prior to joining Chancellor, Mr. Moeller was an Economist at Citibank from 1979 to 1984. He also analyzed pricing behavior in the metals industry for the Council on Wage and Price Stability in Washington, D.C. In 1999, Mr. Moeller received the award for most accurate forecast from the Forecasters' Club of New York. From 1990 to 1992 he was President of the New York Association for Business Economists. Mr. Moeller earned an M.B.A. in Finance from Fordham University, where he graduated in 1987. He holds a Bachelor of Arts in Economics from George Washington University.
More Economy in Brief


