 Global| Nov 18 2003
CPI Unchanged
by:Tom Moeller
|in:Economy in Brief
Summary
The Consumer Price Index (CPI-U) was unchanged (2.1% y/y) last month following a 0.3% gain in September. Consensus expectations were for a 0.1% rise. Energy prices fell 3.9% as gasoline prices dropped 6.8% (9.8% y/y). So far in [...]

The Consumer Price Index (CPI-U) was unchanged (2.1% y/y) last month following a 0.3% gain in September. Consensus expectations were for a 0.1% rise.
Energy prices fell 3.9% as gasoline prices dropped 6.8% (9.8% y/y). So far in November gasoline prices have fallen another 3.3%. Fuel oil prices fell for the second month, down 1.3% (+10.3% y/y) and piped gas & electricity prices fell 1.1% (8.0% y/y).
Analysis from the Federal Reserve Bank of Dallas titled "Business Cycles: The Role of Energy Prices" can be found here.
Food prices were firm last month and rose 0.6% (2.9%). Meat prices have been strong, rising 1.8% in October and 7.8% y/y.
Less food & energy prices were somewhat firmer than expected, up 0.2% (1.3% y/y) versus Consensus expectations for a 0.1% rise.
Core services prices firmed last month and rose 0.4%, reflecting a 0.4% (2.4% y/y) gain in shelter prices. Public transportation prices also were firm, up 1.1% (3.9% y/y). Medical care services prices rose 0.4% (4.1% y/y).
Prices of core consumer goods continued to deflate led by a 0.3% (-2.1% y/y) decline in prices for new vehicles. Prices for household furnishings & operation rose 0.2% (-2.2% y/y), the first monthly gain since February. Apparel prices also rose 0.2% (-1.6%).
Tobacco prices rose 0.2% (-0.2% y/y). The CPI less food, energy & tobacco rose 0.2% (1.3% y/y).
The chained CPI which adjusts for shifts in consumer buying behavior was unchanged. It is similar to the PCE price deflator. The core price measure rose 0.4%.
| Consumer Price Index | Oct | Sept | Y/Y | 2002 | 2001 | 2000 |
|---|---|---|---|---|---|---|
| Total | 0.0% | 0.3% | 2.1% | 1.6% | 2.8% | 3.4% |
| Total less Food & Energy | 0.2% | 0.1% | 1.3% | 2.3% | 2.7% | 2.4% |
| Goods less Food & Energy | -0.3% | -0.4% | -2.5% | -1.1% | 0.3% | 0.5% |
| Services less Energy | 0.4% | 0.2% | 2.9% | 3.8% | 3.7% | 3.3% |
| Energy | -3.9% | 3.0% | 8.8% | -5.8% | 3.7% | 16.9% |
| Food & Beverages | 0.6% | 0.2% | 2.9% | 1.8% | 3.1% | 2.3% |
| Chained CPI: Total (NSA) | 0.0% | 0.3% | 1.6% | 1.3% | 2.3% | 2.0% |
| Total less Food & Energy | 0.4% | 0.1% | 0.8% | 1.8% | 2.0% | 1.4% |
by Tom Moeller November 18, 2003

The U.S. Government budget deficit deepened to $69.5B in October. That was deeper than the $54.1B deficit in October of last year but near Consensus estimates for a $71.0B deficit.
Federal net expenditures surged 15.0% versus last year due to a 29.4% jump in defense spending. Spending on health programs rose 8.4% and spending on education rose 7.9%. Growth in Medicare outlays jumped 15.7% y/y and Social Security outlays rose 4.0%. Interest expense fell 4.4% y/y.
Net receipts jumped 9.1% versus last year. That reflected a jump in corporate income taxes which more than doubled versus last October. Individual tax payments fell 0.1% y/y. Social insurance contributions rose 2.8% y/y and excise taxes rose 0.4%.
| US Government Finance | Oct | Sept | Oct '02 | FY2003 | FY2002 | FY2001 |
|---|---|---|---|---|---|---|
| Budget Balance | $-69.5B | $26.3B | $-54.1B | $-374.2B | $-157.8B | $127.3B |
| Revenues | $135.8B | $191.7B | 9.1% | -3.8% | -6.9% | -1.7% |
| Outlays | $205.4B | $165.3B | 15.0% | 7.2% | 7.9% | 4.2% |
by Tom Moeller November 18, 2003
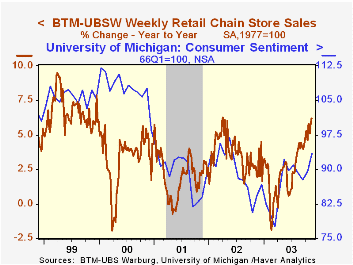
Chain store sales eased 0.8% last week following a 1.2% pop the week prior according to the BTM-UBSW survey.
So far in November sales are 0.5% ahead of last month's average. That followed a 0.6% m/m decline during all of October.
During the last five years there has been a 61% correlation between the year-to-year percent change in the BTM-UBSW measure of chain store sales and the change in non-auto retail sales less gasoline.
The BTM-UBSW retail chain-store sales index is constructed using the same-store sales reported by 78 stores of seven retailers: Dayton Hudson, Federated, Kmart, May, J.C. Penney, Sears and Wal-Mart.
| BTM-UBSW (SA, 1977=100) | 11/15/03 | 11/08/03 | Y/Y | 2002 | 2001 | 2000 |
|---|---|---|---|---|---|---|
| Total Weekly Retail Chain Store Sales | 421.7 | 425.3 | 6.2% | 3.6% | 2.1% | 3.4% |

Tom Moeller
AuthorMore in Author Profile »Prior to joining Haver Analytics in 2000, Mr. Moeller worked as the Economist at Chancellor Capital Management from 1985 to 1999. There, he developed comprehensive economic forecasts and interpreted economic data for equity and fixed income portfolio managers. Also at Chancellor, Mr. Moeller worked as an equity analyst and was responsible for researching and rating companies in the economically sensitive automobile and housing industries for investment in Chancellor’s equity portfolio. Prior to joining Chancellor, Mr. Moeller was an Economist at Citibank from 1979 to 1984. He also analyzed pricing behavior in the metals industry for the Council on Wage and Price Stability in Washington, D.C. In 1999, Mr. Moeller received the award for most accurate forecast from the Forecasters' Club of New York. From 1990 to 1992 he was President of the New York Association for Business Economists. Mr. Moeller earned an M.B.A. in Finance from Fordham University, where he graduated in 1987. He holds a Bachelor of Arts in Economics from George Washington University.
More Economy in Brief


